Ethereum Price Holds Above $1,850 as $2,100 Resistance Remains in Focus
Key Takeaways
- •Ether traded around $1,878 on Aug. 14 and remained above the $1,850 support area after recovering from June lows.
- •Analysts identified $2,100 as the next major resistance level and said a move above it would challenge the current lower-high structure.
- •Trading data showed Ethereum’s broader trend was still downward despite the recent rebound, with lower highs forming from the 2025 peak.
- •Binance exchange supply was reported near 3% of total ETH supply, indicating reduced immediate selling capacity but not enough demand to drive a breakout.
- •U.S. spot Ethereum ETFs recorded $6.72 million in net inflows on Aug. 13, led by Grayscale’s Ethereum Mini Trust.
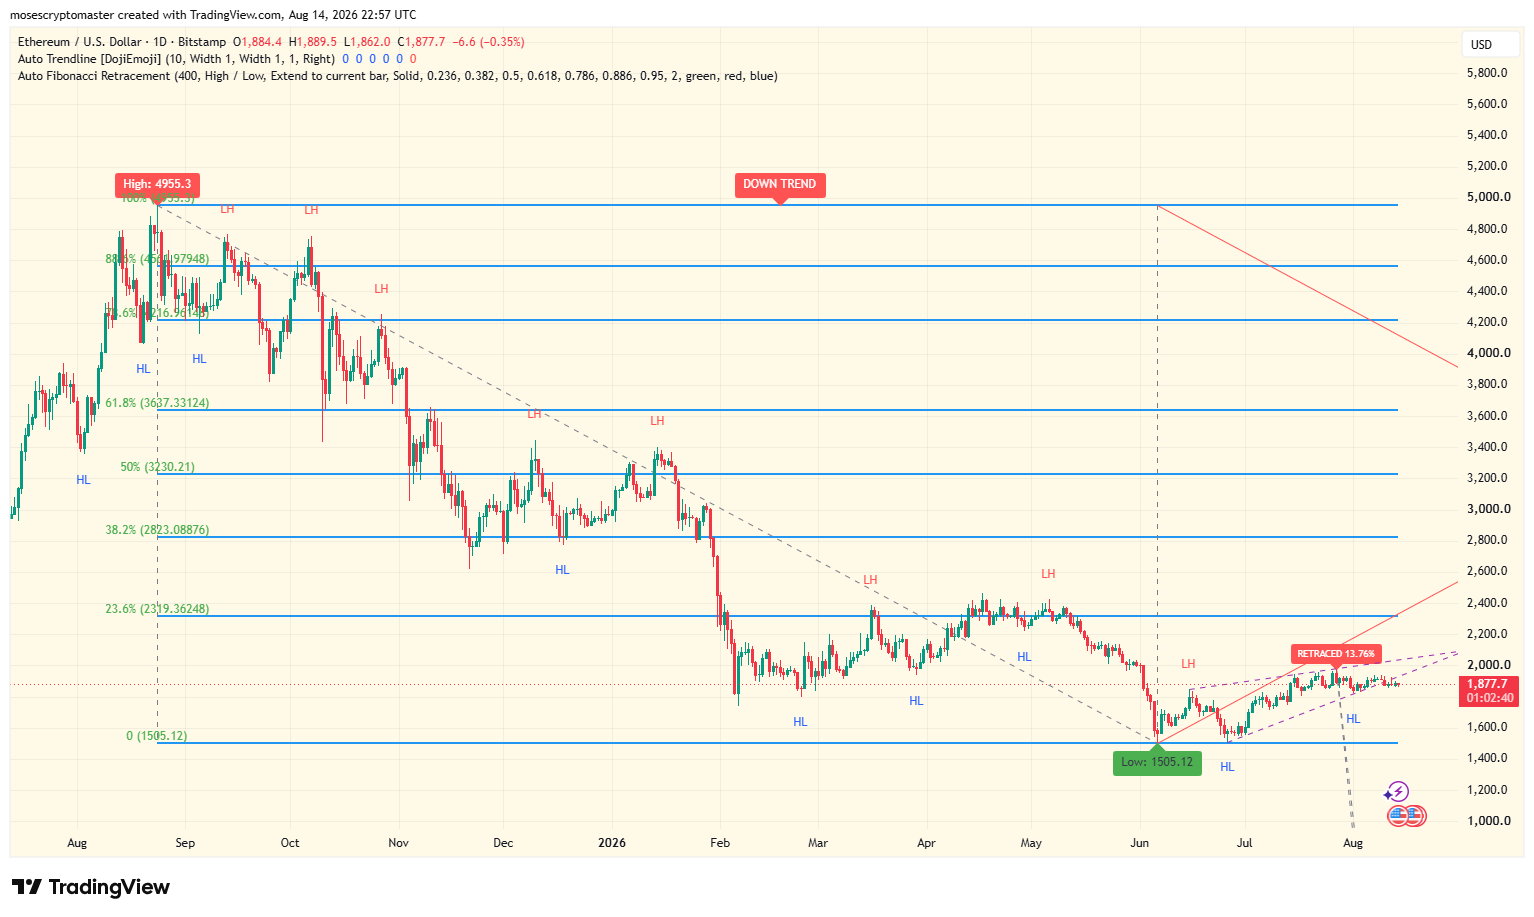
Ethereum price USD held above $1,850 while the broader structure remained bearish.
The $2,100 resistance remained the next higher-time-frame technical test.
Staking and exchange data showed tighter supply but limited fresh demand.
Ethereum, the second-largest digital asset by market capitalization, traded near $1,878 late Thursday as Ether remained trapped below $2,100 resistance. The market held above the $1,850 area after recovering from June lows, and traders were watching to see whether the rebound could extend against a broader descending structure.
The setup carried added significance because several indicators were sending mixed signals. Price action remained weak on higher time frames, while staking reduced liquid supply. Exchange data also showed limited sell-side availability, but demand remained insufficient for a confirmed breakout.
Ethereum Holds Above Near-Term Support
TradingView data showed Ether at $1,878.10 at 22:43 UTC on Aug. 14. The daily chart placed price above the $1,850 support area after a narrow August consolidation. The same chart showed ETH still far below its August 2025 peak near $4,955.
Coinbase data placed Ethereum near $1,880 during the same trading window. Coinbase also reported about $5.71 billion in 24-hour volume and a $226.42 billion market capitalization. Those figures pointed to active trading, but price remained confined within a relatively narrow range.
Daan Crypto Trades identified $1,750 and $2,100 as the main higher-time-frame levels. He said both zones had repeatedly acted as support and resistance during the previous two years. Daan added that reclaiming $1,750 provided an early strength signal, while $2,100 remained the next test.
Broader Trend Still Points Lower
The TradingView chart showed a sequence of lower highs from the 2025 peak. Ether fell toward $1,505 in June before rebounding into the current consolidation area. Fibonacci levels on the chart placed the first major retracement near $2,319, which sat just above the $2,100 resistance and placed the first two recovery hurdles close together on the chart.
Daan Crypto Trades described the larger trend as down despite the recovery above support. His analysis treated a move through $2,100 as the next technical confirmation level. Failure there could preserve the existing lower-high structure.
Crypto Patel offered a much longer-term scenario based on Ethereum’s three-week chart. He identified the $3,400-to-$4,400 region as a macro reclaim zone. Patel explicitly framed his higher targets as a market-structure roadmap rather than a prediction.
On-Chain Data Shows a Tighter Tradable Supply
CryptoQuant analyst PelinayPA reported an exchange supply ratio near 3% for Binance. The ratio measured Ethereum held on Binance against total ETH supply. PelinayPA argued that lower exchange availability reduced immediate selling capacity but did not create demand by itself.
PelinayPA also noted that recent liquidations affected long positions more heavily than shorts. That reduced leverage on the bullish side without creating a large short base. Her assessment therefore favored sideways or weaker short-term action unless fresh spot demand entered.
CryptoQuant also reported that Binance’s Ethereum Exchange Whale Ratio reached 0.71 this month. The reading marked its highest level since March 7, based on CryptoQuant’s dataset. A higher whale ratio indicated that large holders represented a larger share of exchange inflows.
Ethereum.org showed about 41.93 million ETH staked, representing roughly 34% of supply. The official staking page listed the annual percentage rate near 2.6%. Staked ETH supports Ethereum validators and remains less immediately available for spot-market selling. Ethereum has run on proof-of-stake since the September 2022 Merge, and staked ETH could not be withdrawn at all until the April 2023 Shapella upgrade enabled withdrawals processed through an exit queue.
That supply backdrop aligned with the staking argument shared by Crypto King. He cited a staking ratio around 34.4% and described the exit queue as limited. Ethereum.org independently confirmed that roughly one-third of ETH remained committed to staking.
Ethereum Nears a $2,100 Resistance Test
Institutional flows offered another measure of demand, although daily totals remained modest. SoSoValue data showed U.S. spot Ethereum exchange-traded funds recorded $6.72 million in net inflows on Aug. 13. Grayscale’s Ethereum Mini Trust led that session with about $6.47 million. The U.S. spot Ethereum ETF suite began trading in July 2024, and its daily flows have since become a closely watched gauge of institutional demand for Ether.
Those inflows contrasted with the weak technical structure but did not confirm a breakout. Ted Pillows separately identified $1,850 as immediate support in his Aug. 14 market commentary. He argued that losing the area could erase much of the rebound.
The next verifiable technical level remains $2,100, based on Daan Crypto Trades’ higher-time-frame framework. A daily move above that zone would challenge the current lower-high pattern. Until then, Ethereum remains between nearby support and established resistance.
The post Ethereum Price USD Holds $1,850 With $2,100 Resistance Ahead appeared first on The Market Periodical .
