Ethereum Price Drops Toward $2,600 as ETF Outflows Trigger Liquidations
Key Takeaways
- •U.S. spot Ethereum ETFs posted roughly $202 million in net outflows on Oct. 6, the largest single-day redemption since Sept. 16, extending a six-session withdrawal streak that has totaled more than $404 million.
- •Ethereum traded near $2,617 on Oct. 7, down about 6.7% from its Sept. 21 high of $2806, amid broader cryptocurrency market weakness following September's gains.
- •Bullish Ethereum positions worth over $157 million were liquidated on Oct. 7, the biggest daily tally since Sept. 15, as futures open interest declined from more than $36 billion last month to about $33 billion.
- •The ten-year U.S. Treasury yield climbed to 5.3%, its highest level since 2002, raising the opportunity cost of holding non-yielding assets such as cryptocurrencies, while French yields approach 5% amid a broader bond selloff.
- •Technically, Ethereum is retesting crucial support at $2,461, which coincides with its April high, and a sustained move above the $2,806 resistance would signal a rally toward $3,000.
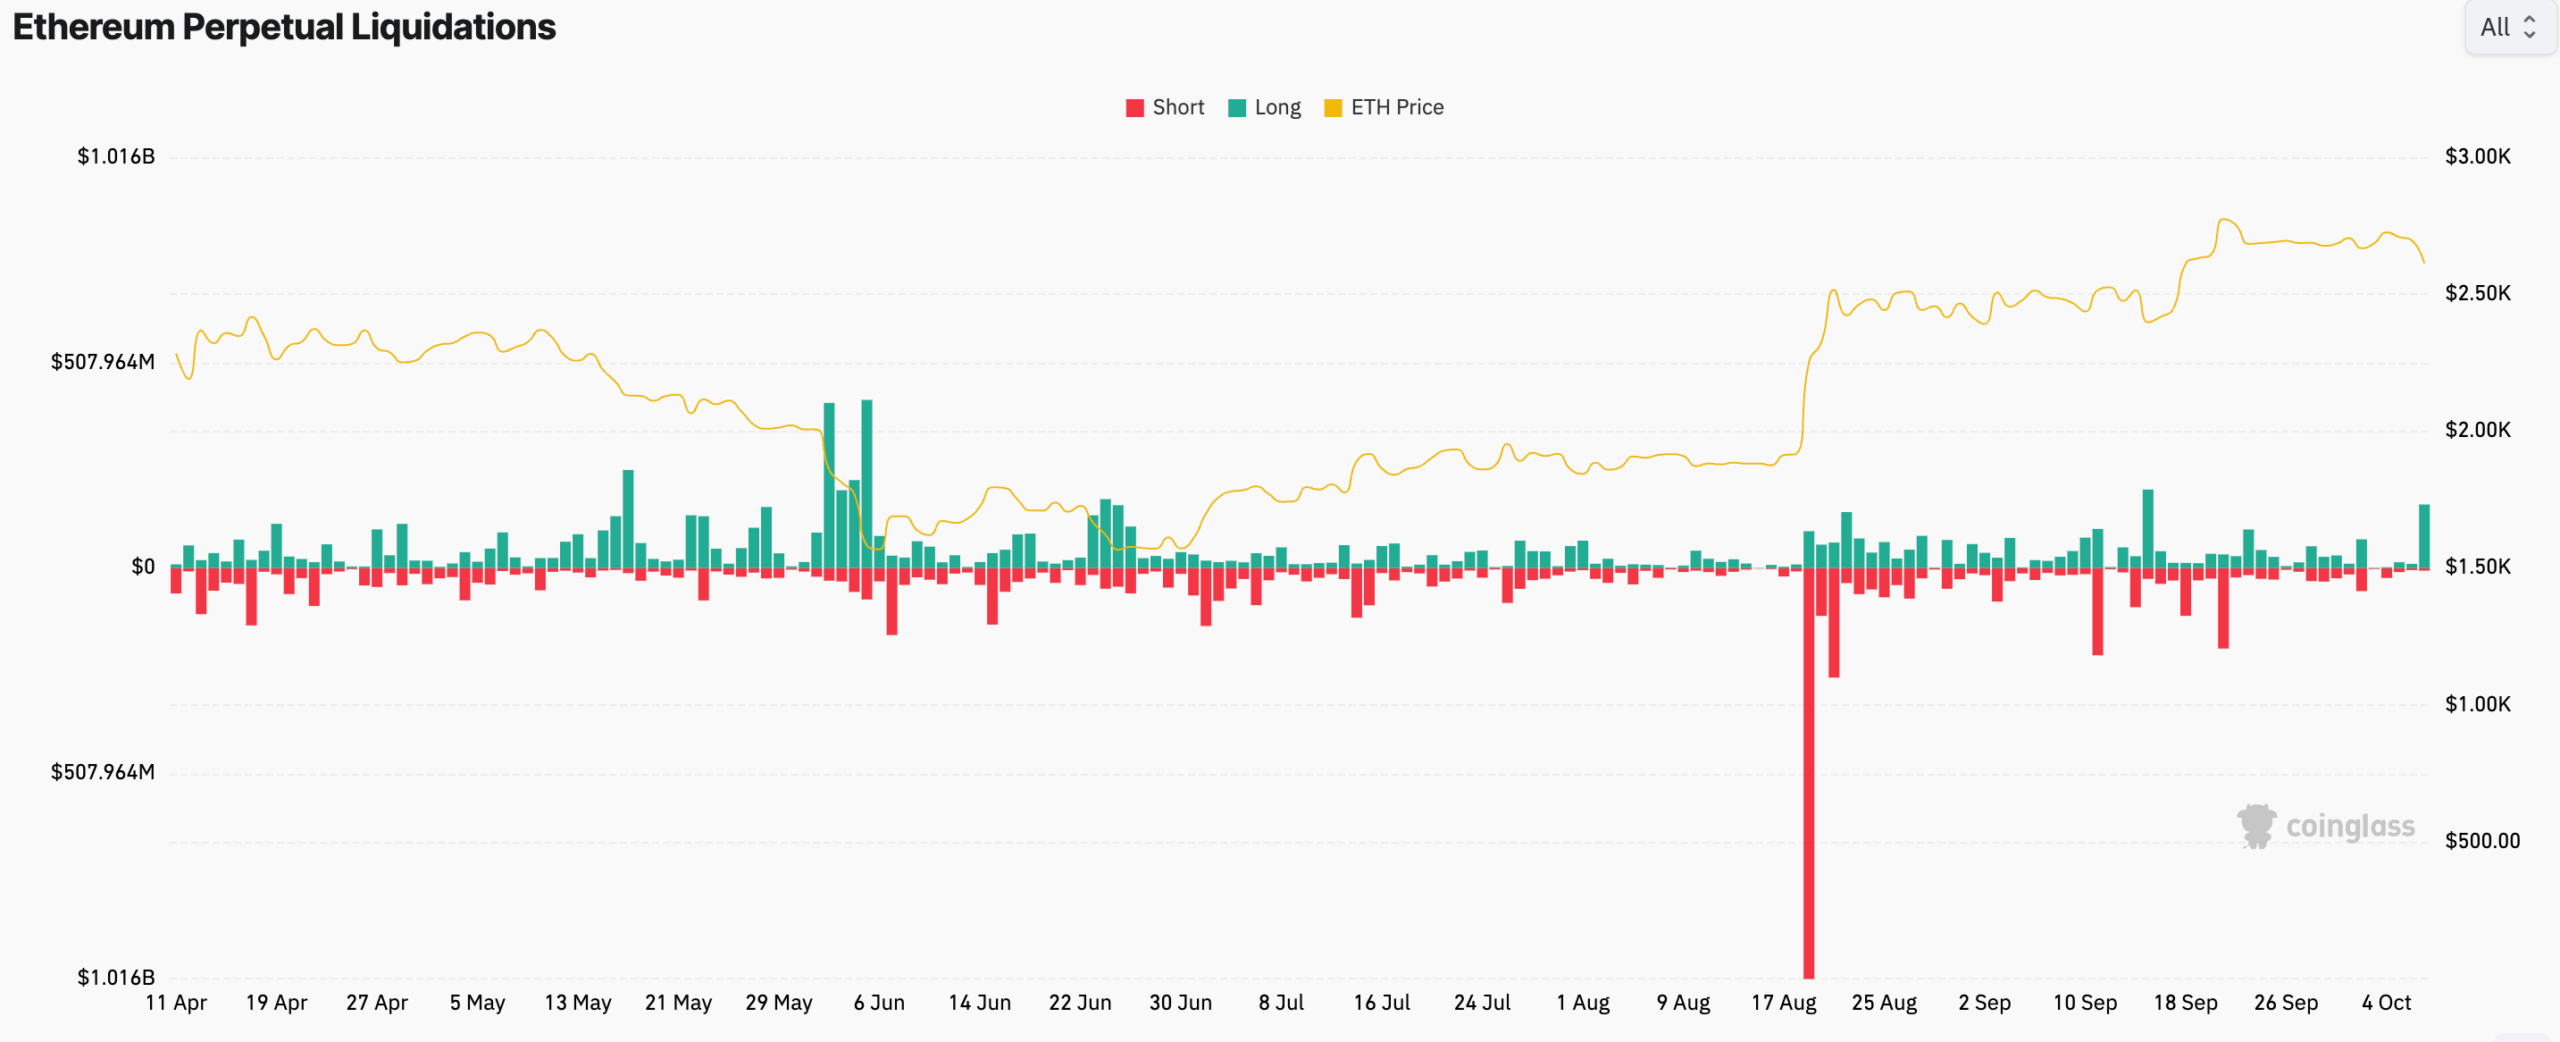
Ethereum fell toward $2,600 on Oct. 7 as its recent recovery lost momentum. ETH traded near $2,617 after retreating about 6.7% from its recent high of $2,806, with the decline arriving alongside heavy redemptions from U.S. spot Ethereum ETFs and a fresh wave of leveraged long liquidations. Elevated U.S. Treasury yields also remained a broader risk for cryptocurrency and other non-yielding assets.
The pullback has coincided with ongoing weakness across the wider cryptocurrency market, with both Bitcoin and Ethereum trading in the red following the substantial gains recorded in September.
ETF Outflows Accelerate
Ethereum has suffered a sharp reversal as demand continues to wane after September's strong run. Data from SoSoValue shows that U.S. investors have kept selling their ETH fund holdings in recent days. U.S. spot Ethereum ETFs recorded roughly $202 million in net outflows on Tuesday, Oct. 6 — their largest single-day redemption since Sept. 16, when the funds experienced more than $224 million in outflows.
The redemptions have now stretched across six consecutive sessions, during which the funds have shed more than $404 million in total. Cumulative net inflows since inception nonetheless stand above $13.5 billion, a base that dwarfs the recent redemption streak and frames the current outflows as a cooling of demand rather than a reversal of the funds' overall growth.
Most of the latest outflows came from the iShares Ethereum ETF (ETHA), which shed over $201 million in assets on Tuesday and now holds $9.6 billion in assets under management.
Rising ETF outflows are widely read as a sign that demand among institutional and retail investors continues to wane. In most cases, falling ETF inflows — or rising outflows — translate into lower prices for the underlying asset.
Leverage has amplified the selloff. Futures open interest has fallen steadily this month, with the daily figure dropping from more than $36 billion last month to about $33 billion. Liquidations occur when price moves breach the margin behind a leveraged position, forcing its closure and converting the trade into a market sale that can deepen short-term swings. CoinGlass data shows bullish Ethereum positions worth over $157 million were liquidated on Oct. 7 the largest daily liquidation tally since Sept. 15.
Ethereum Falls as Bond Yields Rise
A likely driver behind the ongoing retreat is the rise in U.S. bond yields. The ten-year Treasury yield, widely viewed as the world's benchmark, climbed to 5.3% — its highest level since 2002. The five-year and three-month yields have also advanced, reaching 5.05% and 4.17%, respectively.
Higher yields have led to jitters across financial markets, potentially prompting investors to rotate into Treasuries. For assets such as cryptocurrencies that generate no yield of their own, higher returns on government debt raise the opportunity cost of holding them. That dynamic also helps explain why gold and silver have remained under pressure this week.
Concerns persist that yields could climb further given the growing U.S. public debt and the possibility that top foreign holders such as China and Japan may sell part of their holdings. The bond selloff is not confined to the United States: French yields are nearing the symbolic 5% threshold, up sharply from their year-to-date low of 3.21%.
Another potential source of weakness is investor rotation back into technology equities. Nvidia stock has jumped to a record high, while S&P 500 Index has continued its relentless rally.
Technical Outlook
On the daily chart, ETH dropped to $1,516, where it formed a double-bottom pattern. That setup triggered a rebound that eventually carried the price to a high of $2,806 on Sept. 21.
On the positive side, the coin has remained above the Supertrend indicator, a volatility-based trend-following tool, on the daily timeframe and has formed a golden cross — a setup in which a shorter-term moving average crosses above a longer-term one — which traders commonly view as a continuation signal.
The price now appears to be attempting to retest the crucial support level at $2,461, which coincides with its April high. That points to a likelihood that Ethereum remains under pressure in the near term before rebounding. A sustained rally would be confirmed by a move above the key resistance at $2,806; a break above that level would point to further gains toward $3,000.
This article is for informational purposes only and does not constitute financial or investment advice. ETF flows, liquidations, interest rates and technical levels may change as market conditions evolve.
Originally reported by The Market Periodical.

