Ethereum Faces $2,550 Weekly Close Test Despite Strong Q3 Gains
Key Takeaways
- •CME FedWatch raised the probability of a quarter-point September rate hike to 87% after the inflation data, up from 72%.
- •U.S. spot Ether ETFs recorded $216.4 million of inflows on September 11, reversing a $29.9 million outflow the previous day.
- •Lookonchain tracked the sale of 167,855 ETH worth $408 million over five days, while Ethereum remained near $2,500.
- •More than $1.21 billion in cumulative long exposure is estimated below $2,405, representing potential rather than realized liquidations.
- •A weekly close above $2,550 could shift attention toward $3,000, while continued rejection would leave $2,405 and $2,400 as nearby downside levels.
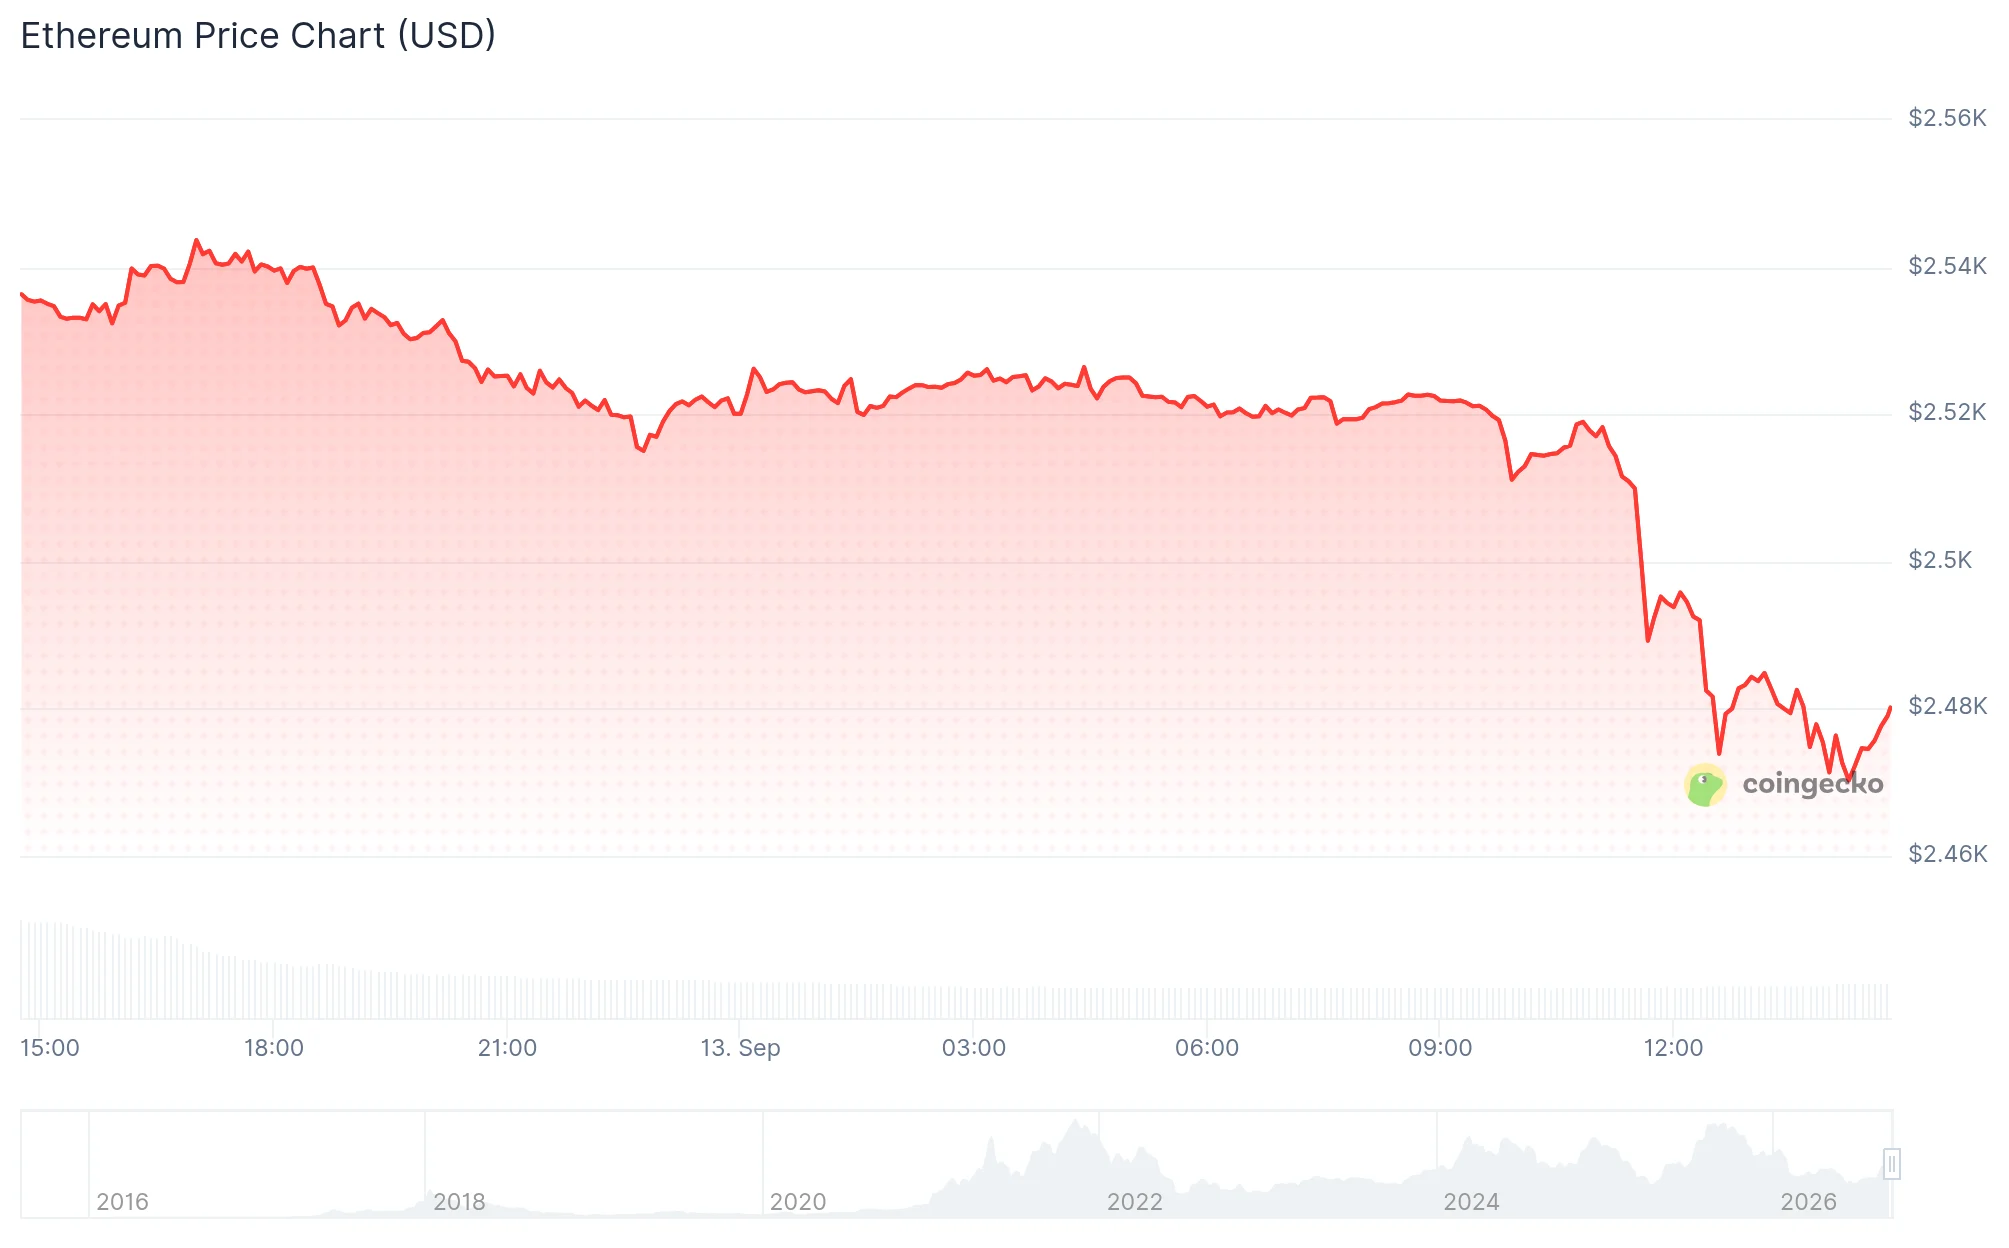
Ethereum fell 1.22% to $2,487.51 at 4:40 a.m. ET, extending a 0.38% seven-day decline and pushing ETH below $2,500. According to CoinGecko data, the token traded within a range of $2,400 to $2,550 after repeated tests of nearby resistance.
A weekly close below $2,550 would leave the $2,400 support area exposed, while a close above that level would reduce the risk of another rejection and put the $3,000 level in focus during September trading. Short-term pressure has followed stronger U.S. inflation readings, firmer Treasury yields and reduced weekend liquidity, although spot Ether exchange-traded funds recorded fresh demand on Friday.
Inflation data increase rate-hike expectations
The Bureau of Labor Statistics reported that August consumer prices rose 0.4% from the previous month and 3.4% year over year. Core CPI increased 0.3% monthly, while annual core inflation eased to 2.4%. Final-demand producer prices rose 0.4% monthly and 5.4% annually.
Interest-rate futures responded to the data. CME FedWatch showed an 87% probability of a quarter-point September rate hike after the CPI release, up from 72% one day earlier. The change in rate expectations lifted Treasury yields and increased financing costs across risk markets, adding pressure as Ethereum encountered selling near an established technical ceiling.
Weekend trading conditions provided another constraint. Crypto order books often have less depth outside normal institutional trading hours, allowing smaller trades to move prices farther and potentially trigger leveraged positions. One derivatives heatmap estimates more than $1.21 billion in cumulative long exposure below $2,405. The figure represents potential liquidations rather than completed losses or on-chain transfers.
Technical indicators have not established a decisive trend. The MACD is in negative territory, while the relative strength index stands at 58.92 and Williams %R at 54.027. The platform classifies all three readings as neutral overall. However, the price’s position near the weekly threshold gives the close greater importance.
Analyst Ted Pillows said a weekly close below $2,550 could weaken the ETH outlook in the coming weeks. The level overlaps with resistance from the 50-week moving average, which is positioned around $2,542 to $2,550.
$ETH has dropped below the $2,500 level. If Ethereum fails a weekly close above the $2,550 level, the next few weeks could be bad for ETH. pic.twitter.com/yoEAc7AZuA — Ted (@TedPillows) September 13, 2026
https://x.com/TedPillows/status/2099067788656554148?ref_src=twsrc%5Etfw
Ethereum would need to regain the $2,550 area to reduce the immediate rejection risk. A failure to do so would keep $2,405 and $2,400 as nearby downside levels. A deeper break could accelerate forced selling among heavily leveraged positions on centralized exchanges.
ETF inflows offset whale distribution
Fund flows provided a counterweight to the pullback. Farside Investors recorded $216.4 million in U.S. spot Ether ETF inflows on September 11, reversing the $29.9 million net outflow recorded on September 10. The September 8-to-11 total consequently reached $196.9 million.
The figures indicate uneven demand rather than a continuous withdrawal. BlackRock’s ETHA led Friday’s inflows with $148.8 million, followed by Bitwise’s ETHW at $29.1 million. Fidelity’s FETH added $11.4 million, while Grayscale’s Ether fund received $5.1 million. ETF demand therefore continued despite the repricing in macroeconomic expectations.
On-chain activity showed a more divided picture. Lookonchain tracked a whale’s five-day sale of 167,855 ETH valued at $408 million. Ethereum remained near $2,500 after the distribution, and the source said this suggested buyers absorbed a large supply event. Earlier reported withdrawals reduced exchange balances by 116,000 ETH during early September.
Lookonchain’s post is available at https://x.com/lookonchain/status/2098445158648066123?s=20.
Strong Q3 performance contrasts with unresolved resistance
An X commentator calculated ETH’s third-quarter gain at 60.62% through September 13. That would make it Ethereum’s second-best third-quarter performance, behind a 66.55% increase in 2025. The gains followed declines in both the first and second quarters.
ETH IS BACK IN THE GAME. $ETH is up 60.62% in Q3 2026, marking its 2nd-best Q3 performance ever. The only stronger Q3 came in 2025, when ETH gained 66.55%. After falling in both Q1 and Q2, this recovery has completely changed the picture. Now the big question: can ETH turn… pic.twitter.com/bMoAvxObxN — Master of Crypto (@MasterCryptoHq) September 13, 2026
https://x.com/MasterCryptoHq/status/2099051391616684225?ref_src=twsrc%5Etfw
Historical performance does not establish that another advance will occur. Ethereum remains within a defined band, with $2,500 acting as a near-term pivot. A weekly close above $2,550 would improve the technical outlook and expose $3,000, while continued rejection would keep attention on $2,405.
ETF demand remained positive through the week, but it does not eliminate immediate liquidation risk. At $2,487.51, Ethereum is positioned between institutional inflows and an unresolved test of weekly resistance.
Source: Blockonomi.

