Ethereum Price Prediction Targets $2,750 if ETH Clears $2,567 Resistance
Key Takeaways
- •Ethereum is trading in a range between roughly $2,350 and $2,560, with its next direction dependent on breaking resistance between $2,545 and $2,567.
- •A daily close above $2,520 to $2,560 would confirm renewed demand, with upside targets near $2,600 and $2,750.
- •Analyst Ted notes most upside liquidity has been removed, leaving only a small cluster near $2,600 before larger long-side liquidity zones between $1,800 and $2,200.
- •Whale orders have largely disappeared from spot markets, and retail shows no concentrated buildup, leaving price action choppy without dominant buying or selling pressure.
- •A break below $2,358 would be the first warning the August breakout is failing, with major support extending from $2,179 to $2,367.
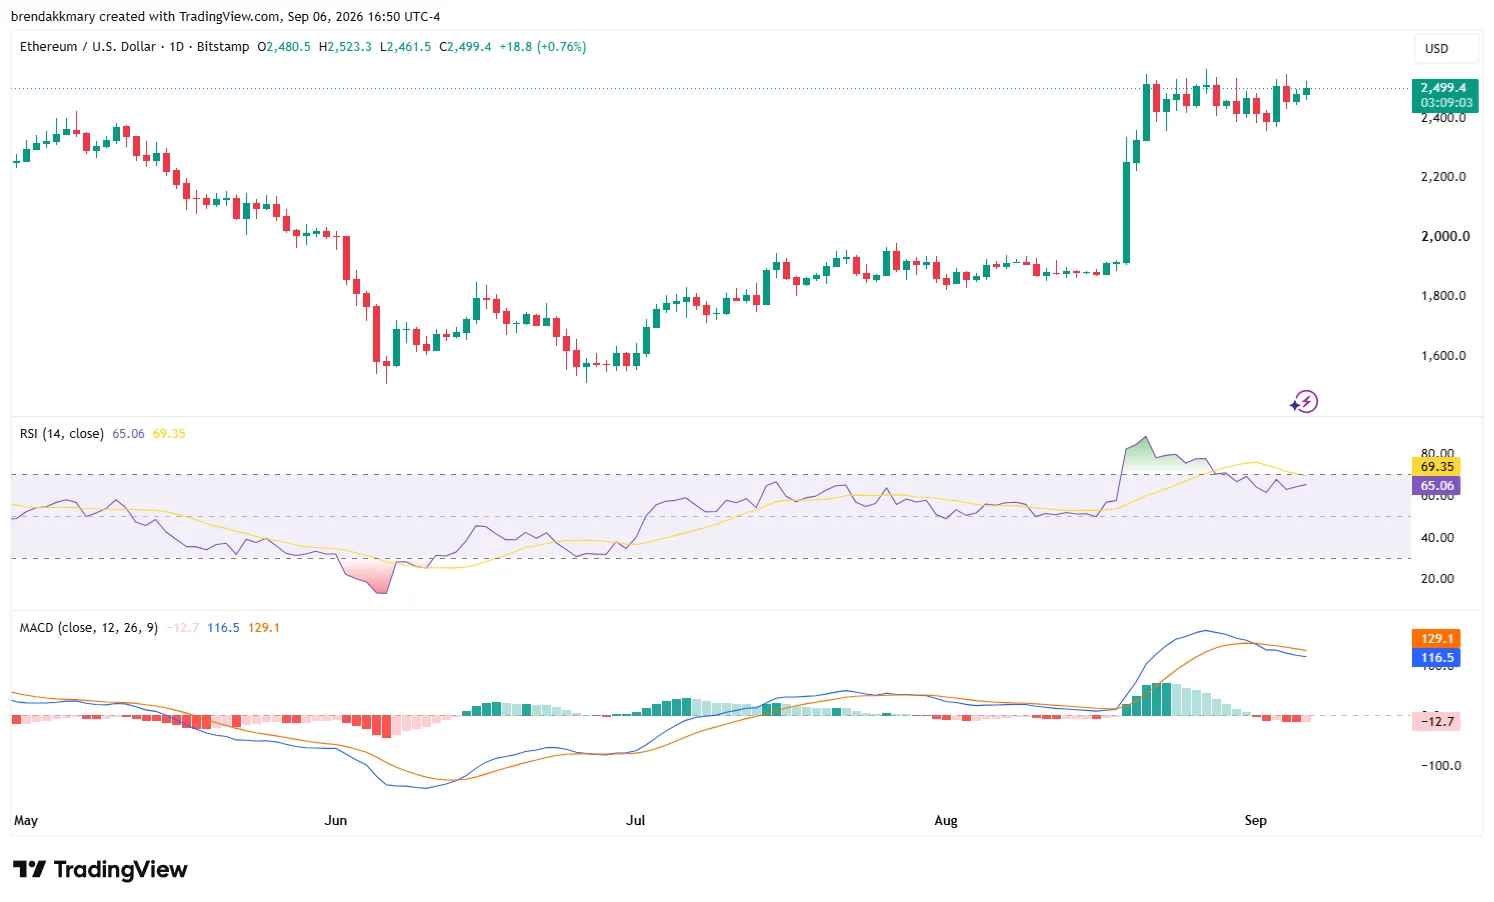
Ethereum trades near $2,500 after buyers defended the floor of its recent range. The Ethereum price prediction now depends on whether demand can clear the resistance band between $2,545 and $2,567. ETH recovered from roughly $2,380, but repeated tests near $2,500 have failed to create sustained momentum. Daily candles show long wicks, reflecting uncertainty after August's advance from below $2,000.
Whale participation has also faded during the latest recovery, limiting conviction behind the move. A breakout could expose $2,600 and $2,750. Conversely, a loss of $2,358 would weaken the structure and increase correction risks toward the $2,179 to $2,367 support zone.
Ethereum Price Prediction Tests Key Resistance Near $2,567
Ethereum's daily structure still favors buyers after the breakout from the $1,850 to $1,920 accumulation base. Price has since entered the $2,440 to $2,520 resistance zone, where neither side has secured control. Several daily sessions tested this band without closing decisively above it. Buyers continue absorbing dips, while sellers respond near the upper boundary. This kind of extended standoff around a prior breakout level is a common pattern in range-bound markets, where price typically resolves only after a decisive daily close beyond one of the boundaries.
The Ethereum price prediction turns stronger if ETH records a daily close above $2,520 to $2,560. Such a move would confirm renewed demand and support another impulsive advance. The first liquidity target sits near $2,600, where analyst Ted identifies a small cluster. Clearing that area could open a path toward $2,750, the next projected resistance.
Ted notes that traders have already removed most upside liquidity. That condition leaves fewer nearby targets after $2,600. It may also increase volatility if buyers cannot attract fresh participation above the current range. Large long-side liquidity sits between $1,800 and $2,200, with additional clusters near $1,500.
Most of the upside liquidity for $ETH has been taken out. There's one small cluster around $2,600, which could be taken out next. After that, Ethereum has large long-side liquidity from the $1,800-$2,200 level. There are liquidity clusters around $1,500 too, but I don't think… pic.twitter.com/IQU7tAUopZ — Ted (@TedPillows) September 6, 2026
The downside structure starts weakening below $2,390 to $2,440 on the daily chart. A firmer break under $2,358 would provide the first warning that the August breakout is failing. The Ethereum price prediction would then shift toward a broader fourth-wave correction. Major support extends from $2,179 to $2,367, while the former $2,080 to $2,150 resistance area offers deeper medium-term demand.
Whale Activity Fades While ETH Holds Its Trading Range
The four-hour chart places ETH inside a broad range between $2,350 and $2,560. Buyers have repeatedly defended the lower section, including the latest rebound from about $2,380. Still, previous pushes into $2,500 to $2,550 have ended without continuation. This pattern supports further sideways trading until price closes beyond either boundary.
For bulls, sustained acceptance above $2,545 to $2,567 would alter the short-term structure. It would also support the Ethereum price prediction for a move through $2,600 and toward $2,750. A rejection could send ETH back toward $2,440, followed by the crucial $2,358 floor. Below that level, the first pullback zone sits between $2,220 and $2,270.
Spot Average Order Size data adds another layer to the current setup. Recent activity near $2,400 to $2,500 mostly reflects normal-sized orders. The green whale orders recorded earlier in the recovery have largely disappeared. Retail orders also show no concentrated buildup, indicating limited aggressive positioning from either group.
That participation gap explains why ETH price action has turned choppy despite holding near resistance. Neither heavy whale demand nor concentrated supply currently dominates spot trading. Consequently, smaller orders can keep price moving within the established band without confirming a directional break. Large-order activity of this kind is often watched as a proxy for institutional or high-net-worth engagement, since whales tend to move price more meaningfully than dispersed retail flow.
The Ethereum price prediction needs renewed large-order activity to support a durable breakout. Strong whale buying near $2,567 would improve confirmation and reduce the risk of another failed attempt.
Conversely, large sell orders near resistance could reinforce the ceiling and redirect price toward support. Market participants are watching $2,358 as the key invalidation level, while $2,567 separates consolidation from the next upside extension. Broader trading volume confirmation would strengthen any sustained move beyond resistance.
