Ethereum Price Prediction Eyes $1,500 as Whale Selling Pressure Builds
Key Takeaways
- •Ethereum traded around $1,804 on Thursday, down 0.55% over 24 hours and 12% across seven days, while participants handling $100,000 to $10 million transactions sold and smaller traders bought.
- •Technical analysis identified $1,710 as a key downside level, with a breakdown potentially opening a path toward $1,500, while clearing $1,850 to $1,900 could enable a move toward $2,050.
- •U.S. spot Ethereum ETFs recorded $39.8 million in net withdrawals on November 18, a third consecutive negative session, bringing outflows over five sessions to $145.5 million.
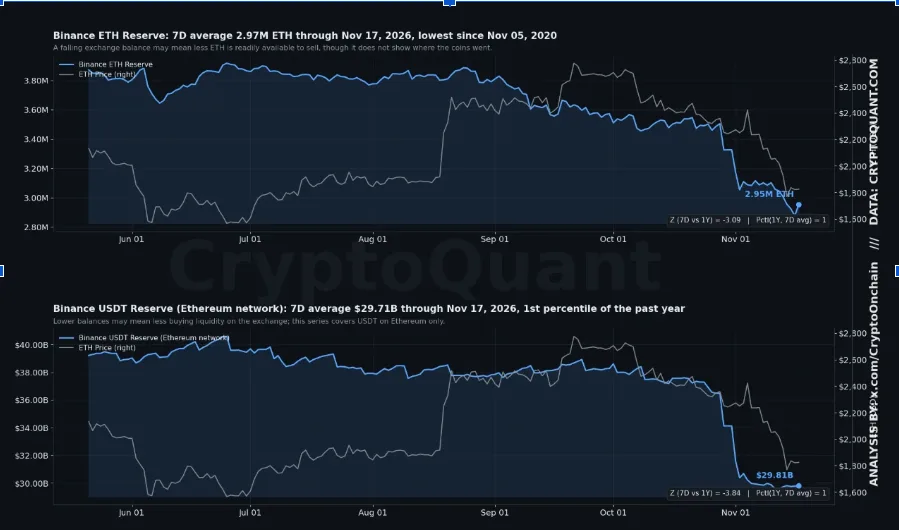
- •Binance's seven-day average ETH reserves fell to 2.97 million through November 17, their lowest level since November 2, 2020, having dropped 11.3% over 30 days as Ethereum's price declined 18.7%.
- •CoinShares disclosed the sale of its $16.6 million Ethereum treasury position, and Federal Reserve meeting minutes showed policymakers discussing the prospect of further monetary tightening.
Ethereum price predictions remained under pressure on Nov. 19 as ETH traded near $1,800, with large market participants continuing to sell while smaller traders showed buying activity during the downturn. Technical analysts identified $1,710 as an important downside level, noting that a sustained breakdown could expose the asset to further losses toward $1,500.
Meanwhile, U.S. spot Ethereum exchange-traded funds (ETFs) recorded their third consecutive session of net withdrawals, and Binance's seven-day average Ethereum reserves reached their lowest level since November 2020.
Whales Sell While Smaller Buyers Step In
Ethereum traded at $1,804 on Thursday, down 0.55% over 24 hours and 12% across seven days. The network's token has struggled to recover after printing successive lower highs and lower lows since early October. Market capitalization stood at $220 billion, with daily volume reaching $10.7 billion. The recent $1,734 low remains a nearby support reference, while $1,817 marks the initial level required for any sustained rebound.
Alphractal analyst Joao Wedson reported in an X post that participants handling transactions between $100,000 and $10 million were selling across several exchanges. Smaller participants continued purchasing during the same period. Wedson also identified a concentration of potential liquidations around $1,200 on Hyperliquid, although those positions can change before ETH approaches that level. Divergences between whale-sized and retail-sized order flow are closely tracked in on-chain analysis because larger transactions carry significantly more notional weight, and liquidation maps such as this one are used to gauge where forced unwinds could cluster if a given price is reached.
Binance ETH Reserves Hit Lowest Since November 2020
CryptoQuant contributor CryptoOnchain reported in a CryptoQuant QuickTake that Binance's seven-day average ETH reserves fell to 2.97 million through November 17, marking their lowest level since November 2, 2020. Binance's reserves dropped 11.3% over 30 days as Ethereum's price declined 18.7% during the same period.
The decline was more concentrated on Binance than at other major exchanges. Combined exchange reserves fell 2.1% to 14.54 million ETH, while Coinbase holdings remained near 3.13 million. Binance's seven-day average USDT reserves on Ethereum also reached $29.71 billion. Across monitored exchanges, USDT balances on Ethereum stood at $41.35 billion, down 11.5%.
CryptoOnchain said ETH might be moving into private wallets or staking, although available data did not confirm its destination. Binance's estimated leverage ratio reached 0.84, while exchange-wide Ethereum open interest dropped 18.2% to $9.53 billion. Lower reserves can lift that ratio without participants adding positions. The analyst's composite reading remained neutral at 0.23. Exchange reserve trends draw attention during drawdowns because coins held on trading platforms are the balances positioned for immediate sale, making them a standard proxy for readily sellable supply.
Triangle Pattern Puts $2,050 and $1,500 in Focus
The ETH/USDT one-hour chart shows a symmetrical triangle forming after Ethereum's recent decline, connecting lower highs with higher lows as the trading range narrows. Symmetrical triangles are conventionally read as compression phases that resolve when price closes beyond one of the converging trendlines, which is why the pattern's boundaries serve as the triggers traders monitor. The analyst identified $1,850 to $1,900 as the area ETH must clear for a possible move toward $2,050. A break beneath $1,710 could instead open a path toward $1,500, though the setup does not confirm either outcome.
Separately, the daily lower Bollinger Band sat near $1,663, while the 20-day moving average stood around $2,067.63.
ETF Withdrawals Continue
U.S. spot Ethereum ETFs posted $39.8 million in net withdrawals on November 18, according to Farside Investors, marking a third consecutive negative session and bringing outflows over five sessions to $145.5 million. BlackRock's ETHA accounted for $17.4 million, while its staked Ethereum product recorded another $5.4 million. Grayscale's two products accounted for the remaining $17 million. Because creations and redemptions are reported daily, ETF flow data has become one of the most closely followed gauges of institutional positioning in Ether.
CoinShares also disclosed the sale of its $16.6 million Ethereum treasury position as part of a broader share repurchase plan. Meanwhile, Federal Reserve meeting minutes released Wednesday showed policymakers discussing the prospect of further monetary tightening under their economic forecasts. Monetary policy expectations are a recurring macro variable for digital-asset markets, and traders routinely parse Fed communications for signals on liquidity conditions.
On a two-week chart, analyst Crypto Patel marked $1,000 to $1,500 as a historical accumulation region, per an X post. Patel identified $1,000 as longer-term support and outlined a possible cycle peak in 2027 or 2028. Beyond the chart levels already in play, upcoming Farside flow reports and further CryptoQuant reserve updates will offer the next checkpoints for whether the withdrawal and reserve trends persist.
This article provides market information and analysis, not investment advice. Cryptocurrency prices remain volatile, and technical forecasts do not guarantee future performance.
This article originally appeared on The Market Periodical.

