Ethereum Tests Key $2,550–$2,660 Resistance as CLARITY Act Vote and FOMC Decision Approach
Key Takeaways
- •Ethereum traded near $2,517 on Sept. 15 as markets awaited a Senate vote on the CLARITY Act, a bill that would set clearer U.S. regulatory jurisdiction over digital assets, and the Federal Reserve's Sept. 16 decision, with markets heavily favoring a quarter-point hike.
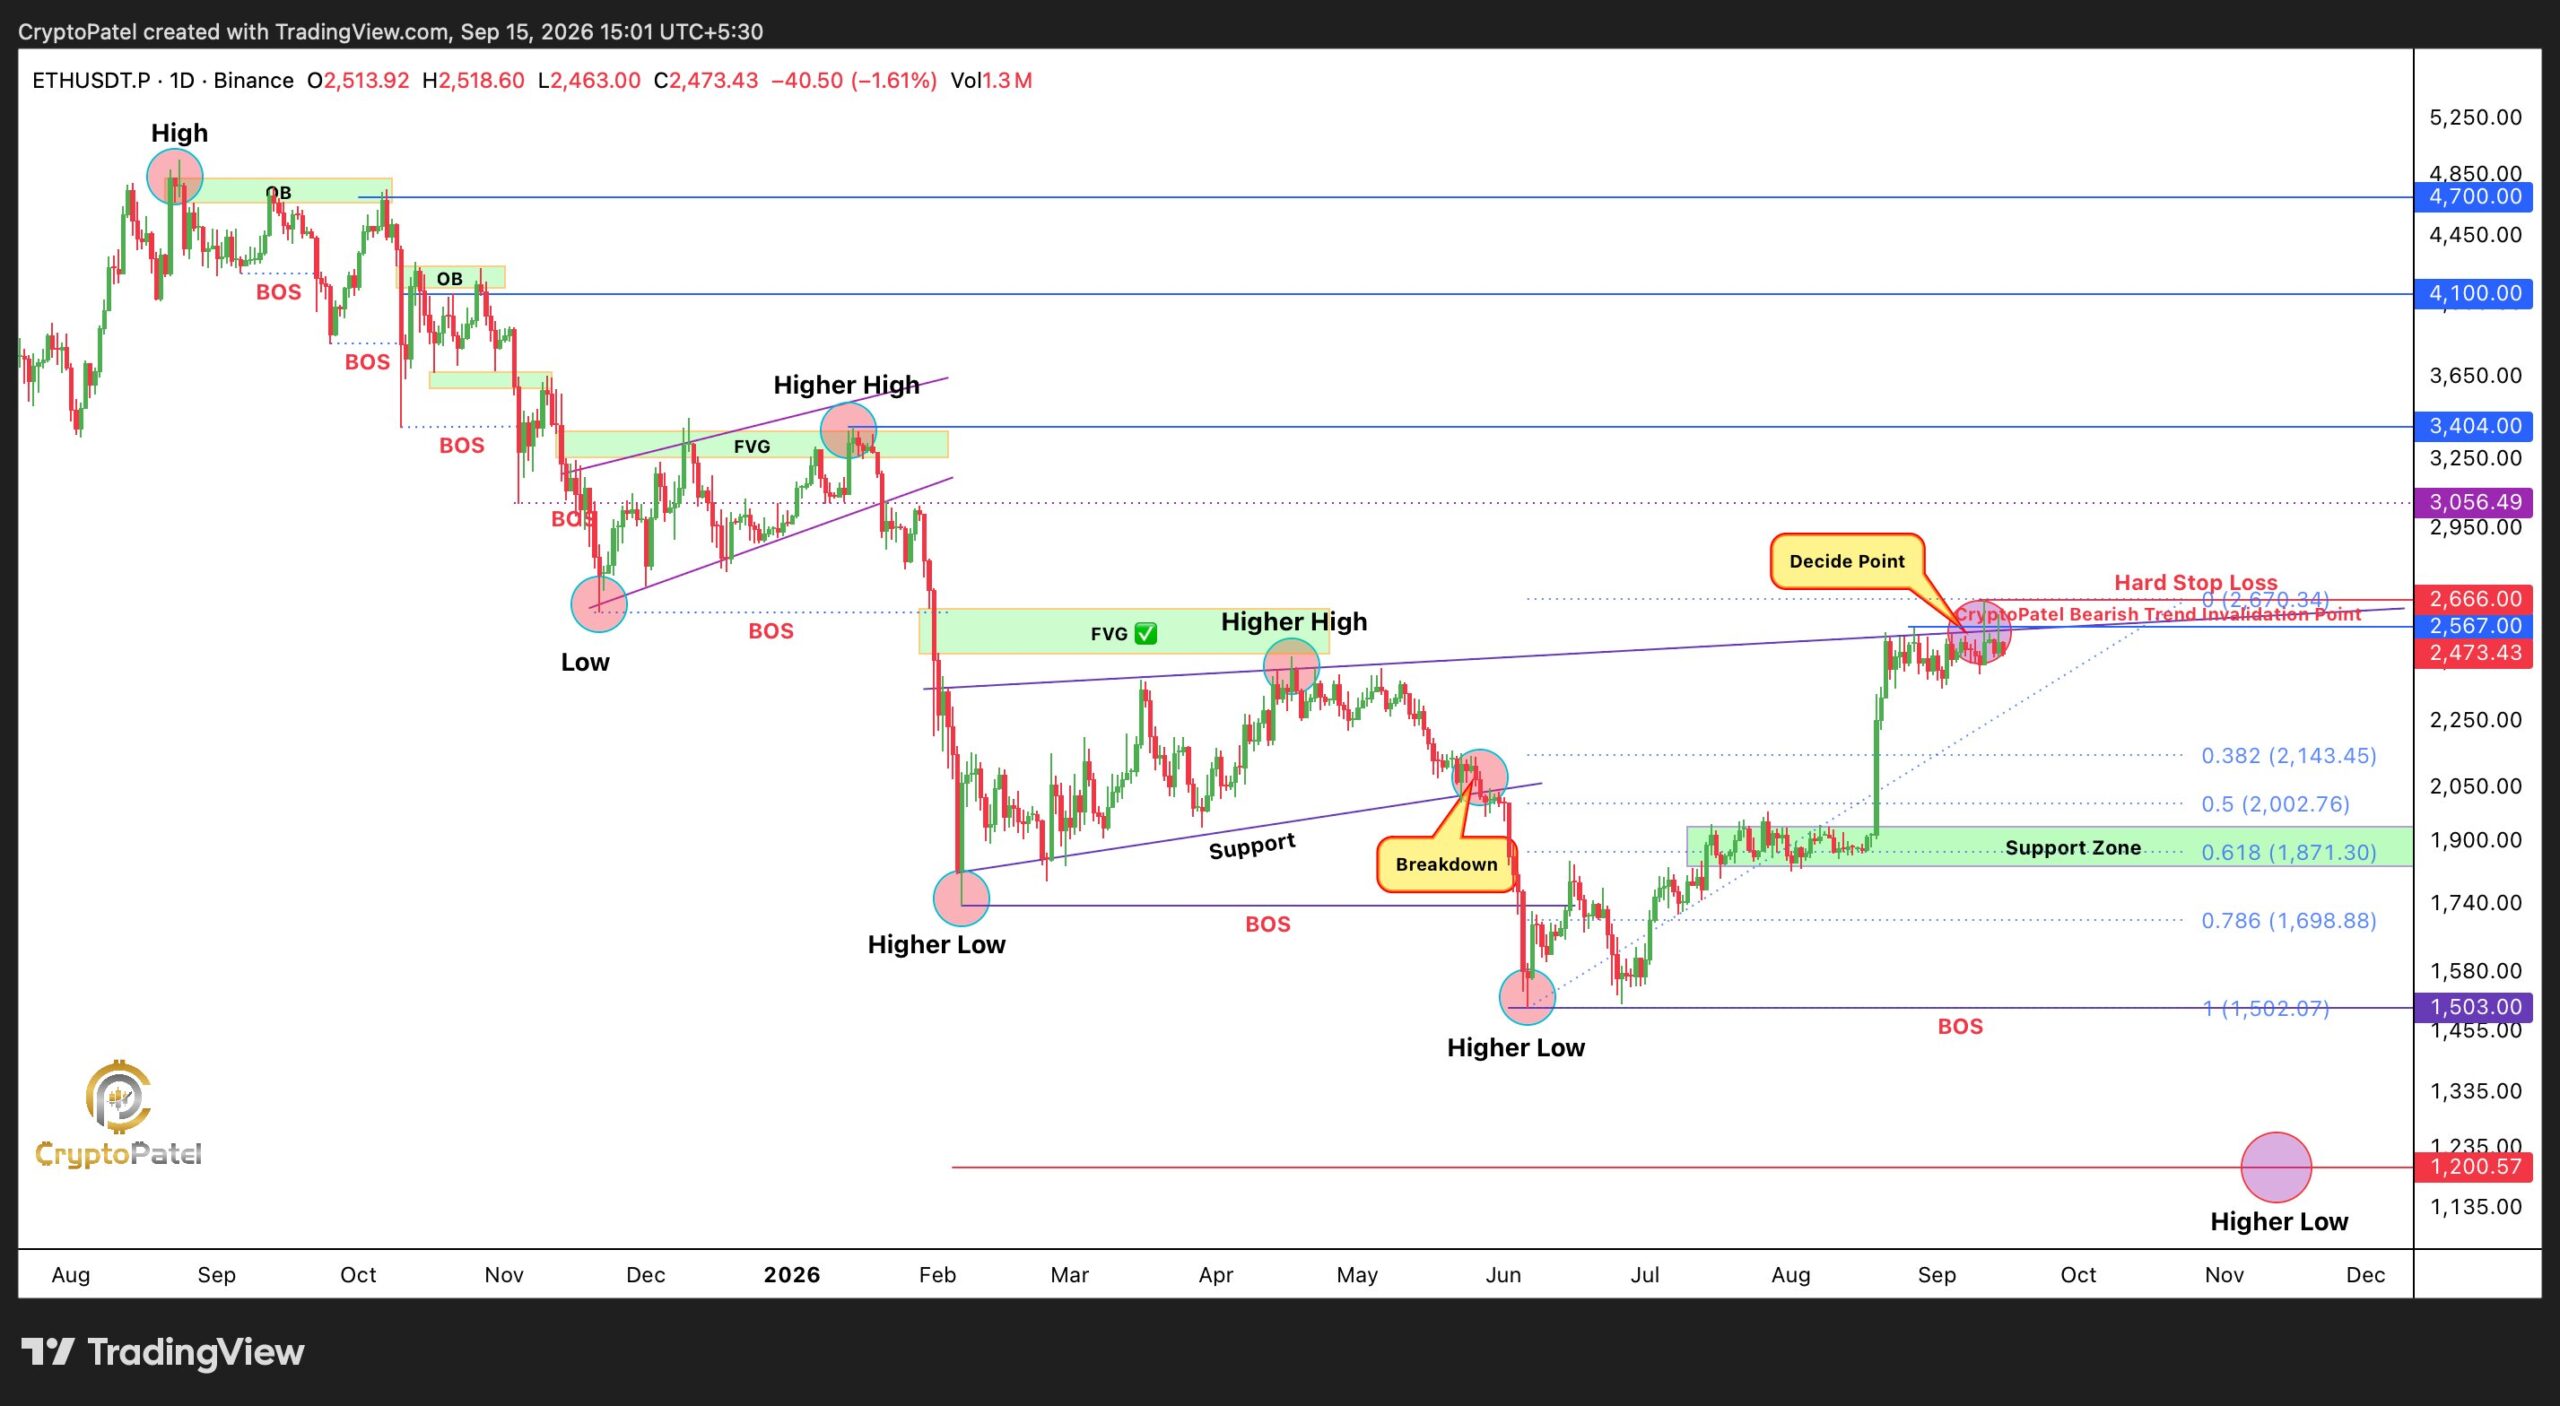
- •Analyst Crypto Patel identified the $2,550–$2,660 zone as converging resistance, stating that a daily close above $2,660 followed by a successful retest would confirm a bullish structural expansion, while failure there could drive declines toward $2,143, $2,000, and $1,870.
- •Analyst Daan Crypto Trades expects heightened volatility around the CLARITY Act vote and FOMC meeting, predicting further ETH downside and choppy price action if the bill fails or is pulled before conditions normalize once both events pass.
- •Spot Ethereum ETFs recorded $121.02 million in net inflows during the Sept. 14 session, led by BlackRock's ETHA at $80.50 million, with additional inflows into Fidelity's FETH, 21Shares' TETH, BlackRock's staked ETHB, and Grayscale's ETH mini fund.
- •Invesco's QETH was the only fund to post an outflow in the Sept. 14 session, recording $5.43 million in net outflows, while Bitwise, Franklin, VanEck, Grayscale's ETHE, and Morgan Stanley reported no net flows.
Ethereum traded near $2,517 on Sept. 15 as traders positioned ahead of two major U.S. policy events: a Senate vote scheduled for Tuesday on advancing the CLARITY Act, a market-structure bill that would set clearer U.S. regulatory jurisdiction over digital assets, and the Federal Reserve's interest-rate decision on Sept. 16, with markets heavily favoring a quarter-point hike. The same-week timing concentrates event risk, since one outcome bears on monetary policy and liquidity conditions while the other bears on digital asset regulation.
The asset has gained more than 30% over the past month but remains below the $2,550–$2,660 resistance zone. The approaching events could heighten short-term volatility as Ethereum tests a technical area that could determine whether the price extends toward $2,800 or pulls back toward $2,143.
Analyst Flags Final Decision Point on Ethereum Chart
Citing the Ethereum price chart, analyst Crypto Patel shared an observation on X that Ethereum is approaching a critical resistance zone between $2,550 and $2,660, where descending trendline resistance, horizontal supply, and structural resistance are converging.
He described the move as a test of the upper boundary of the prevailing market structure. According to Patel, a strong breakout above $2,660, followed by a daily close and a successful retest, would confirm a bullish structural expansion.
On the downside, the key support levels to watch include $2,143, which is the 0.382 Fibonacci level, followed by $2,000 at 0.5 and $1,870 at 0.618, while major support stands at $1,500.
Patel added that if Ethereum fails to break above the $2,550–$2,660 supply zone or the ascending trendline, a corrective move toward $2,143, $2,000, and $1,870 could follow. He noted that the setup would be invalidated if ETH breaks past $2,670. In his view, the next directional move will depend on liquidity displacement.
Volatility Expected Around CLARITY Act Vote and FOMC
Analyst Daan Crypto Trades noted on X that Ethereum is entering another major period of high volatility just ahead of the CLARITY Act vote and the Federal Open Market Committee (FOMC) meeting. He said traders have been pre-positioning ahead of the uncertain events, which could eventually create conditions of heightened volatility, with the price able to swing wildly in either direction. The overlap of the two events matters because they work through different channels: Fed rate decisions feed into the liquidity and borrowing-cost expectations that risk assets are priced against, while the CLARITY vote goes to how crypto market activity would be supervised under U.S. law.
Market expectations for the CLARITY Act vote appear limited at this stage, according to the analyst. If the bill fails or is pulled, he expects further downside in ETH, followed by choppy price action into the FOMC meeting. Once both events pass, he expects Ethereum to return to more normal price action. The near-term markers are the vote outcome on Tuesday, the Fed's Sept. 16 statement, and — within Patel's framework — whether a daily close lands above $2,660 or the price holds the $2,143 support.
Spot Ethereum ETF Inflows Continue
Inflows into spot Ethereum ETFs have continued to remain strong. Spot crypto ETFs offer traditional investors exchange-listed exposure to Ether without direct custody of the asset, and their daily net flows are widely read as a gauge of institutional demand. During the Sept. 14 trading session, Ether ETFs recorded $121.02 million in net inflows, led by BlackRock's ETHA at $80.50 million, according to data from Farside Investors.
Fidelity's FETH recorded $8.86 million in inflows, while 21Shares' TETH saw $6.47 million. BlackRock's staked ETHB recorded $14.39 million, and Grayscale's ETH mini fund added $16.23 million.
Invesco's QETH was the only fund to post an outflow, recording $5.43 million in net outflows. Bitwise's ETHW, Franklin's EZET, VanEck's ETHV, Grayscale's ETHE, and Morgan Stanley's MSSE reported no net flows.
Disclaimer
This article is for informational purposes only and does not constitute financial or investment advice. Cryptocurrency investments involve risk, and macroeconomic or legislative outcomes can cause sharp price volatility. Readers should conduct their own research before making investment decisions.

