Ethereum Price Prediction: Can ETH Hold $2,400 as Binance Withdrawals Surge?
Key Takeaways
- •Ethereum reserves held on Binance fell to 3.47 million ETH, the lowest level in six months and a decline of roughly 11.5% from approximately 3.92 million in August.
- •Binance recorded more than 320,000 Ethereum withdrawal transactions on Oct. 6, marking a record daily total in the historical data tracked by CryptoQuant.
- •Ethereum traded near $2,490 on Oct. 9, up more than 2% in 24 hours, after a correction that cut its market capitalization by over $38 billion while altcoins excluding Bitcoin shed more than $110 billion across three days.
- •The $2,400 level stands as a key support threshold, with a sustained break below it potentially opening the way to $2,350 and a demand zone around $2,360, while weekly chart resistance sits near $2,800 and higher at $3,447.
- •Declining exchange reserves do not by themselves reveal why holders moved their ETH, since tokens may have shifted to private wallets, other platforms, or staking, so reserve trends are generally read alongside price and volume data.
Ethereum stabilized near $2,480 on Oct. 9 after a sharp market correction pushed ETH back toward levels last seen roughly a month earlier. The pullback coincided with a substantial decline in Ethereum reserves held on Binance and a record surge in withdrawal activity, according to CryptoQuant data. Exchange-reserve and withdrawal metrics are among the most closely watched on-chain indicators, since coins sitting in exchange wallets are the ones available for near-instant trading on a given venue.
Key Insights
- Ethereum reserves on Binance fell to 3.47 million ETH, a six-month low, representing a decline of about 11.5%.
- Binance recorded more than 320,000 withdrawal transactions on October 6, setting a record for daily withdrawals on the exchange.
- Ethereum traded near $2,490, up over 2% in 24 hours, with $2,400 acting as support and $2,800 as resistance.
$2,400 Support Comes Into Focus
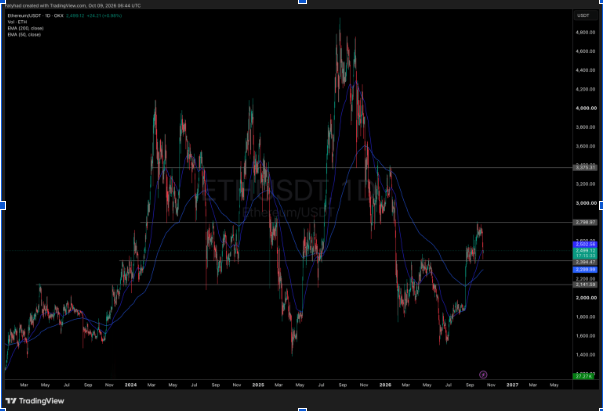
Ethereum traded around $2,490 on October 9, up more than 2% over the previous 24 hours. The daily chart shows ETH retreating after its recent attempt to move toward $2,800. The asset also traded close to its 50-day exponential moving average (EMA), which stood near $2,503 on the chart. Moving averages of this kind are widely used to track medium-term trend, and stretches when price trades close to the line are often watched for signals on whether momentum is holding or fading.
Initial support sits around $2,470, followed by the $2,440 area. The $2,400 level remains another important threshold for traders monitoring the current pullback. A sustained move below this level could bring $2,350 into view, alongside the broader demand zone around $2,360.
On the weekly chart, resistance is marked around $2,800, with a higher resistance level near $3,447. A break above $2,800 would put the next zone in focus. Until then, Ethereum's ability to hold nearby support remains a key factor in its short-term price direction.
Binance Ethereum Reserves Fall to a Six-Month Low
CryptoQuant data shows that Ethereum reserves on Binance declined from approximately 3.92 million ETH in August to 3.47 million in October. The latest figure marks the lowest reserve level in six months. More recently, reserves fell from roughly 3.57 million ETH to 3.47 million during the market downturn, and the drop from August represents a decline of about 11.5%.
Exchange reserves track the amount of cryptocurrency held in exchange wallets, meaning Binance now holds fewer ETH than it did two months earlier. The reserve decline does not, by itself, explain why holders moved their ETH. Some investors may transfer tokens to private wallets for long-term storage, while others may move them to different platforms or use them for staking and other blockchain activities. For that reason, reserve trends are generally read alongside price and volume data rather than in isolation.
Binance ETH Withdrawals Reach a Record High
CryptoQuant recorded more than 320,000 Ethereum withdrawal transactions on Binance on October 6. The figure marks a record daily total in the historical data shown on the chart, with activity rising sharply at the latest reading.
The increase came during a broader market correction. Over three days, the total market capitalization of altcoins, excluding Bitcoin, declined by more than $110 billion. Ethereum's market capitalization fell by more than $38 billion as its price dropped around 11% during the same period.
Withdrawal transactions count movements from exchange wallets rather than the number of individual investors or the amount of ETH withdrawn. Because CryptoQuant publishes these series daily, upcoming reserve and withdrawal readings will show whether the Oct. 6 pace continued or normalized in the sessions that followed.
This article is for informational purposes only and does not constitute financial or investment advice. Exchange-reserve data, withdrawal activity, and technical levels may change as market conditions evolve.
This article first appeared on The Market Periodical.

