Ethereum Holds Above $1,900 as Buyers Eye the $2,000 Resistance
Key Takeaways
- •Ethereum is holding around $1,918, with trading constrained between the 50-day EMA near $1,864 and the 100-day EMA around $1,924.
- •The 50-day EMA is the key near-term support, and staying above it keeps the short-term outlook constructive.
- •A sustained move above $1,924 could lead ETH toward the $2,000 resistance and then the 200-day EMA near $2,124.
- •RSI is near 56 and MACD is improving, indicating buying momentum is present but not yet fully confirmed.
- •If Ethereum falls below $1,864, the current bullish bias could weaken and deeper downside levels may come into view.
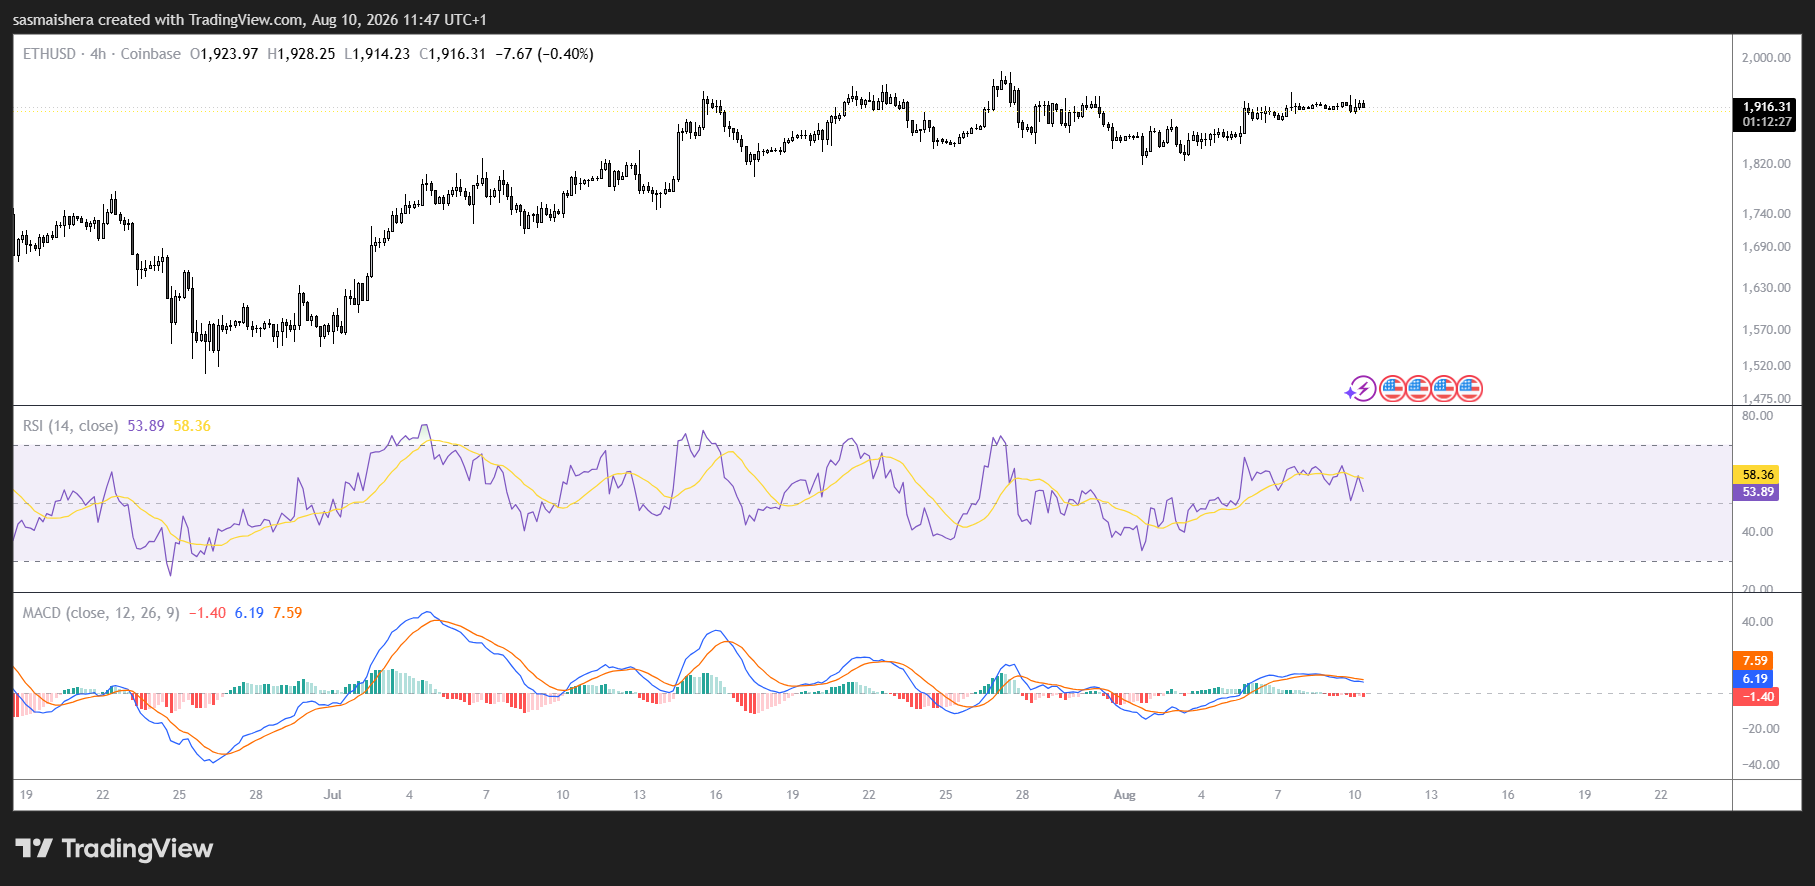
Ethereum consolidates near $1,918
Ethereum (ETH) is trading around $1,918, maintaining a mildly constructive short-term outlook as buyers continue to defend the zone above its 50-day Exponential Moving Average (EMA). The second-largest cryptocurrency by market capitalization currently sits in a narrow range between the 50-day EMA at approximately $1,864 and the 100-day EMA near $1,924.
This tight band reflects an ongoing tug-of-war between buyers attempting to extend the recent recovery and sellers holding firm at a longer-term resistance threshold. Ethereum's ability to remain above the 50-day EMA indicates that traders are still purchasing on dips. However, a decisive breakthrough above the 100-day EMA is needed to build stronger upward momentum.
As the backbone of decentralized finance, stablecoins, and the bulk of on-chain token activity, Ethereum's price behavior often reflects broader sentiment toward the smart contract ecosystem. Technical levels on ETH are closely watched not only by spot traders but also by participants in derivatives and on-chain markets, making breaks above key moving averages consequential for liquidity flow across multiple venues.
ETH buyers defend the 50-day EMA
The 50-day EMA at $1,864 serves as Ethereum's most critical near-term support level. ETH trading above this metric signals that the short-term trend is gradually improving and that buyers remain engaged during pullbacks. Holding above this moving average would keep alive the possibility of a breakout toward the $2,000 mark.
On the upside, Ethereum continues to face resistance from the 100-day EMA at $1,924. This indicator has become an immediate ceiling and may continue to cap the recovery unless trading volume and buying intensity increase. A sustained daily close above $1,924 would offer an early signal that bullish forces are taking control.
Momentum indicators paint a cautiously optimistic picture
Ethereum's momentum indicators support a guardedly positive outlook. The Relative Strength Index (RSI) stands near 56, above its neutral midpoint of 50 but well below the overbought threshold of 70. This reading points to steady buying momentum while leaving room for further gains before the rally becomes technically overstretched.
Meanwhile, the Moving Average Convergence Divergence (MACD) line remains slightly negative but continues to improve. This configuration suggests that bearish momentum is fading, though it has not yet confirmed a fully entrenched bullish trend. Taken together, the RSI and MACD indicate that buyers are progressively strengthening their position.
Key resistance levels to watch
Ethereum's first immediate resistance sits at the 100-day EMA near $1,924. A decisive move above this level could open the door to the psychological and horizontal resistance at $2,000. This round-number area will likely serve as a significant test, as such thresholds frequently attract heavier selling pressure and profit-taking.
A sustained breakout above $2,000 would bolster Ethereum's technical structure and bring the 200-day EMA at approximately $2,124 into play. The 200-day EMA is a particularly important barometer of the broader long-term trend. ETH would need to reclaim this level to signal a more meaningful bullish reversal.
In summary, Ethereum's recovery faces three major overhead barriers:
- The 100-day EMA at $1,924
- The psychological resistance at $2,000
- The 200-day EMA at $2,124
Clearing $1,924 would reinforce the short-term outlook, while a push above $2,000 could draw additional buying interest. The 200-day EMA at $2,124, however, remains the broader trend ceiling. Failure to break through this moving average could leave Ethereum exposed to renewed selling pressure following any short-term rally.
Support structure below current prices
The current pivot zone around $1,918 provides Ethereum's initial support. If ETH slips below this level, the 50-day EMA at $1,864 becomes the next critical defensive area. Buyers must hold this moving average to preserve the constructive short-term technical structure.
A decisive break beneath $1,864 could weaken momentum and raise the risk of a deeper correction. In that scenario, the distant horizontal support at $1,385 could eventually come into play, though intermediate support zones may slow any decline.
For now, Ethereum retains a mildly bullish bias above the 50-day EMA. A confirmed close above $1,924 is required to clear the path toward $2,000 and potentially the 200-day EMA at $2,124. Beyond the chart, participants are also monitoring developments in Ethereum's network upgrade roadmap and regulatory clarity around digital assets, both of which have historically influenced risk appetite and positioning around ETH.
Source: CoinJournal

