Ethereum Price Forecast: ETH Risks Further Losses as It Slides to $1,803
Key Takeaways
- •Bitcoin, Ethereum, and XRP posted weekly losses of more than 12%, 13%, and 12% respectively, extending their declines into Monday amid selling pressure and weakening investor confidence.
- •Bitcoin now trades below $65,000, while Ethereum has fallen to roughly $1,803 after a weekly decline exceeding 13%.
- •Ethereum's daily RSI stands around 25, well inside the oversold zone below 30, suggesting selling pressure has become stretched and a short-term relief rally is possible.
- •Despite the oversold RSI, Ethereum's MACD remains deeply negative and the price sits below its major daily EMAs, indicating bearish momentum continues to dominate.
- •Ethereum's immediate resistance is $1,823, with further barriers at the 50-day EMA near $2,260, the 100- and 200-day EMAs around $2,283, the psychological $2,400 level, and a broken trendline near $2,479.
Bitcoin (BTC), Ethereum (ETH), and XRP extended their declines on Monday after another difficult week for the cryptocurrency market, with the three major digital assets recording weekly losses of more than 12%, 13%, and 12%, respectively — a reflection of widespread selling pressure and weakening investor confidence.
Bitcoin now trades below $65,000, while Ethereum has fallen toward $1,800, and both cryptocurrencies have so far struggled to establish a sustainable recovery. Technical indicators suggest the recent declines may be becoming overstretched, with BTC and ETH registering deeply oversold Relative Strength Index (RSI) readings. Even so, bearish Moving Average Convergence Divergence (MACD) signals and prices holding below major moving averages indicate that sellers continue to control the broader trend. While a short-term relief rally remains possible, the technical outlook suggests recovery attempts could face significant resistance.
Ethereum drops to $1,807 as sellers maintain control
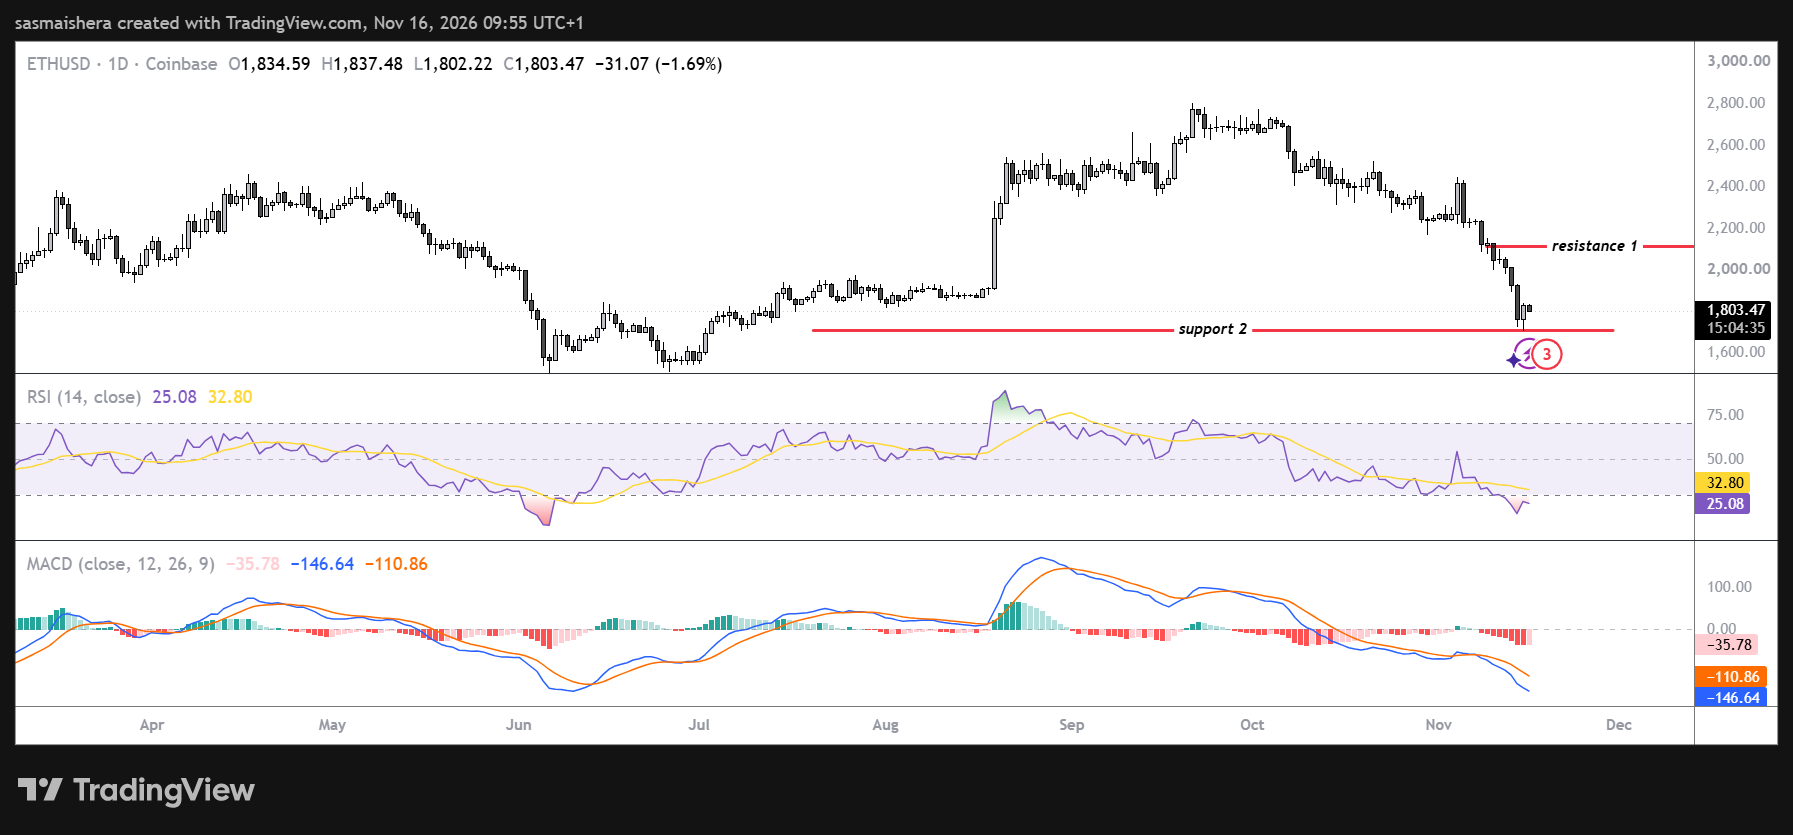
Ethereum has struggled to stabilize following a weekly decline exceeding 13%. The second-largest cryptocurrency trades around $1,803 on Monday, extending its correction as bearish momentum continues to dominate.
Like Bitcoin, Ethereum remains significantly below its major daily moving averages — indicators widely followed as trend gauges because they smooth out price action over a set period. The 50-day exponential moving average (EMA) stands near $2,260, while the 100-day and 200-day EMAs are both positioned around $2,283. The concentration of these moving averages above the current price suggests Ethereum would face substantial resistance if buyers attempt a recovery, and trading below the major EMAs reinforces the cryptocurrency's broader bearish technical structure.
Meanwhile, Ethereum's daily RSI stands around 25. The RSI is a momentum oscillator measured on a scale from 0 to 100, with readings below 30 conventionally viewed as oversold, placing Ethereum well inside that zone. The reading suggests selling pressure has become stretched, potentially increasing the likelihood of a short-term relief rally. However, the MACD — a tool that tracks the relationship between moving averages to signal shifts in momentum — remains deeply negative, signaling that bearish momentum has not yet meaningfully weakened. The divergence between oversold momentum readings and the prevailing downtrend creates uncertainty for traders: although a temporary rebound could emerge, Ethereum would need to reclaim important resistance levels before the technical outlook begins to improve.
Ethereum technical outlook: Can ETH reclaim $1,823?
Ethereum's immediate resistance stands at $1,823, a horizontal level that could determine whether the cryptocurrency can establish a short-term recovery. With ETH trading around $1,807, the resistance barrier sits just above the current market price, and a sustained move above $1,823 would suggest that buyers are beginning to regain some control.
Even then, Ethereum would still face a substantial gap before reaching its major moving averages. The next important resistance stands at the 50-day EMA near $2,260, beyond which the 100-day and 200-day EMAs around $2,283 form another significant barrier. A decisive recovery above these moving averages would provide stronger evidence that Ethereum's bearish trend is beginning to reverse.
Further upside resistance stands at the psychological $2,400 level. Above this, the previously broken ascending trendline around $2,479 could limit additional gains, and a more distant resistance level is positioned near $2,770. These higher targets remain secondary, however, while Ethereum struggles to reclaim $1,823.
On the downside, the supplied analysis does not identify a clear structural support level below the current price — the zones where buyers have previously stepped in and which traders typically use to gauge where declines may slow — increasing uncertainty about where buyers could establish a sustainable floor if selling pressure continues.
For now, Ethereum's deeply oversold RSI suggests that a temporary recovery is possible, but the negative MACD and overhead moving averages indicate that bearish momentum remains dominant.
This article is based on analysis originally published by CoinJournal: Ethereum price forecast: ETH risks further losses as it drops to $1,803.

