Ethereum Faces $1,800 Downside Risk Despite Bullish ETH/BTC Signal
Key Takeaways
- •Ethereum closed near $2,360 on Oct. 28 after failing to clear the $2,400 resistance level, where sellers repeatedly re-emerged during rebound attempts.
- •The token's decline from roughly $2,800 earlier in October included a breakdown beneath an ascending trendline that had connected a series of higher lows since the summer.
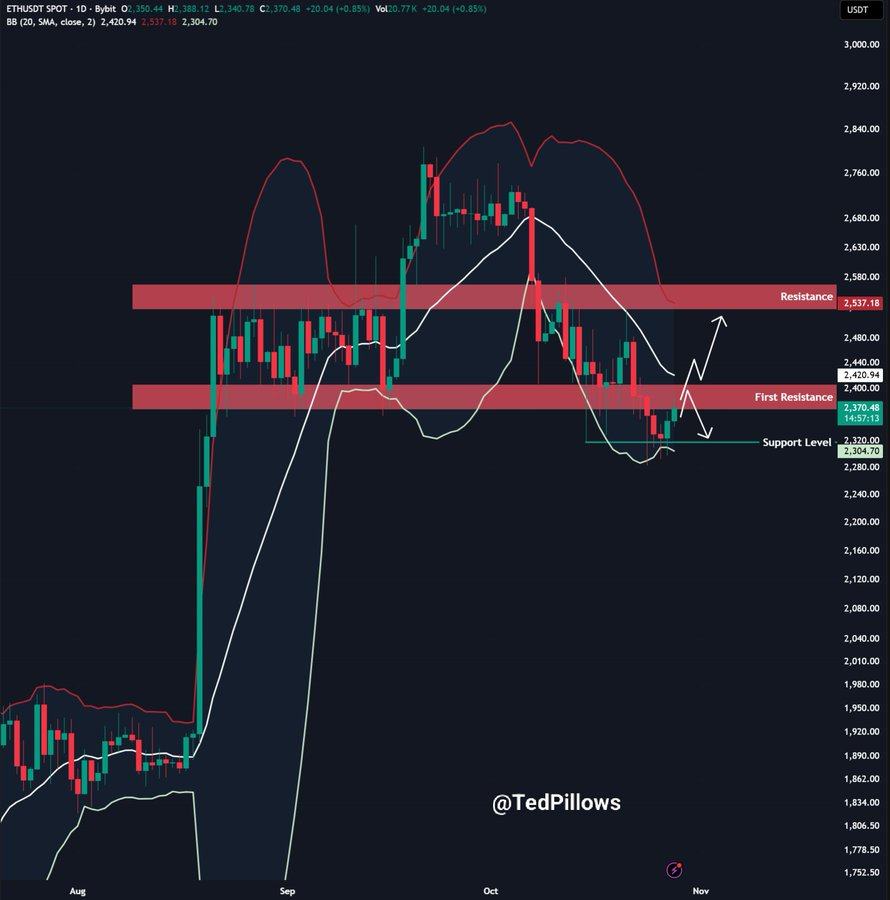
- •Ted Pillows identified $2,320 as immediate support near the lower Bollinger Band at $2,305, with additional resistance around $2,537 and the middle band at approximately $2,421.
- •Whale Factor outlined a bearish scenario toward $1,800, roughly 24% below the Oct. 28 close, while setting a broader recovery threshold at $2,683 with upside projections of $3,430 and a separate path toward $3,000.
- •A bullish MACD crossover on the ETH/BTC pair resembles an earlier setup that coincided with an approximately 280% rally, raising the prospect of Ether outperforming Bitcoin.
Ethereum, the second-largest cryptocurrency by market value, remained under pressure after an attempted recovery failed to clear $2,400. The cryptocurrency closed near $2,360 on Oct. 28 before sellers returned to the market. Technical commentators are now weighing competing scenarios — a possible decline toward $1,800, according to Whale Factor, or a broader recovery — while a momentum signal on the ETH/BTC pair has raised questions about potential Ether outperformance. Separately, an analyst identified a bullish ETH/BTC MACD crossover resembling an earlier setup that coincided with a roughly 280% rally.
Sellers Defend the $2,400 Level
Ethereum fell toward $2,300 after trading near $2,800 earlier in October. The daily chart showed a recovery from the $2,320 region, but the rebound had yet to clear nearby resistance, and recent sessions saw sellers return during rebounds into the same price band.
Crypto analyst Ted Pillows identified $2,400 as the first level Ethereum needs to reclaim. His outlook placed initial resistance around the current trading range and marked another barrier near $2,537, a level that coincided with the upper Bollinger Band on the daily chart. Bollinger Bands are a volatility indicator whose upper and lower bands are plotted around a moving average. The same indicator placed its middle band near $2,421. A move above $2,400 would therefore bring an additional technical level into view before ETH reaches the higher resistance zone. Until then, projections continued to show the altcoin trading below the middle band following October's decline.
Broken Uptrend Shifts Focus to Lower Support
The daily structure changed after Ethereum slipped beneath an ascending trendline extending from the summer. Whale Factor showed that the trendline connected a series of higher lows before the breakdown, and the token subsequently moved into the area the analyst labeled the selling zone.
Whale Factor placed the next broader recovery threshold at $2,683. A move above that boundary would return Ethereum to a higher trading range, with $3,430 appearing as an upside projection.
On the downside, Ted Pillows' chart marked $2,320 as immediate support, while the lower Bollinger Band stood near $2,305, placing two technical references close together. Whale Factor outlined a more extended bearish scenario toward $1,800 if the wider breakdown continues — a level that would sit roughly 24% below the Oct. 28 close near $2,360.
An Alternative Path Points Toward $3,000
A separate two-day Ethereum chart presented a different outlook despite the recent weakness. It marked approximately $2,516 as a horizontal reference level above the current market range, and a projected path showed the price moving through that area before eventually approaching the $3,000 region. The illustration also allowed for a possible retreat after that projected advance. The chart followed a decline from approximately $2,800 toward the middle $2,000 region before the latest consolidation.
Another analyst focused on a fair value gap and a monthly naked point of control above $3,000, arguing that Ethereum could visit the higher reference level before a deeper correction into the gap. A point of control marks the price where the most volume changed hands on a given timeframe, while a "naked" one has not been revisited since it formed; a fair value gap, meanwhile, is an imbalance zone left behind when price moves rapidly through an area.
ETH/BTC Chart Draws Comparison With an Earlier Rally
The Ethereum-to-Bitcoin trading pair offered a different measure of market performance. A long-term ETH/BTC chart compared the current base with an earlier consolidation that preceded a strong advance, marking the previous rise at approximately 280% and proposing another large move from the current base. An increase in the ETH/BTC ratio would show Ether gaining ground relative to Bitcoin, even if the two assets moved very differently against the dollar — one reason the pair serves as a common barometer of relative strength between the sector's two largest cryptocurrencies.
The chart also showed a moving average convergence divergence (MACD) crossover near the lower part of its range — a momentum indicator built from the relationship between two moving averages — and the analyst compared the current indicator setup with that earlier period of improving momentum.
This article is for informational purposes only and does not constitute financial advice. Cryptocurrency investments involve substantial volatility and potential losses. Readers should conduct independent research before investing.

