Ethereum ETFs Post $141 Million in Net Outflows as ETH Holds Near Key Support
Key Takeaways
- •U.S. spot Ethereum ETFs recorded $141 million in net outflows on Sept. 15, with BlackRock's ETHA responsible for approximately $97.97 million, or about 69% of the day's total.
- •Ethereum's decline followed the Senate's failure to advance the CLARITY Act through a cloture vote, leaving the timing of U.S. federal crypto market-structure rules unresolved.
- •The Federal Reserve raised its benchmark rate by 25 basis points to 3.75%-4.00% on Sept. 16, a decision tracked for its influence on liquidity conditions across risk markets.
- •Combined Bitcoin and Ethereum ETF net outflows reached roughly $591 million in the session, including $450 million from U.S. spot Bitcoin ETFs and about $215 million from Fidelity's FBTC.
- •ETH is trading near its 50-week EMA at $2,382, where a weekly close below could expose supports near $2,225, $1,965, and $1,713, while reclaiming $2,547 is required for the short-term structure to improve.
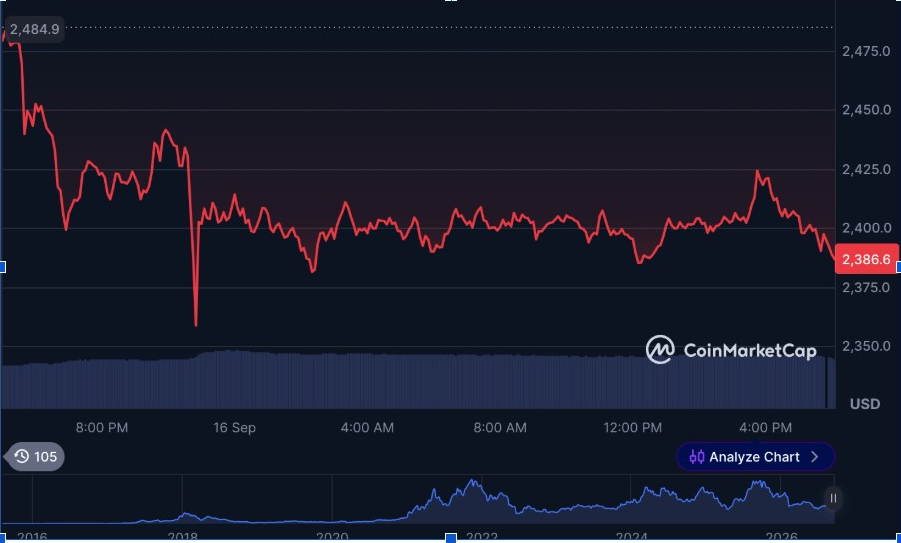
Ethereum traded near $2,400 on Sept. 17 after U.S. spot Ethereum exchange-traded funds recorded $141 million in net outflows. ETH had fallen sharply during the previous session before stabilizing around a major technical support area.
The selloff followed the Senate’s failed CLARITY Act cloture vote and came ahead of the Federal Reserve’s Sept. 16 rate decision. The Fed has since raised its benchmark rate by 25 basis points to 3.75%-4.00%. The CLARITY Act is a U.S. digital-asset market-structure bill, and the failed cloture vote means it did not clear the procedural step needed to advance toward final Senate passage, leaving the timing of federal crypto rules unresolved. Rate decisions are tracked across risk markets because they help shape the broader liquidity conditions in which assets like ETH trade.
Ethereum Price Trend After CLARITY Act Stalls
Ethereum reached an intraday high of $2,484.90 before sellers pushed the price toward approximately $2,360. The token later recovered modestly but remained below $2,400.
The decline followed the Senate’s failure to advance the CLARITY Act, adding uncertainty around U.S. cryptocurrency regulations. Major crypto assets also weakened as traders prepared for the Federal Reserve’s latest interest-rate decision. Until the Senate revisits the bill, U.S. crypto market-structure legislation remains an open regulatory item for market participants to track alongside Fed policy.
After failing to sustain its earlier recovery, ETH moved back toward an important long-term technical area. The price also remains below the 50-week simple moving average near $2,468. That level has become immediate resistance because buyers have not established a sustained move above it.
A stronger recovery would require ETH to regain $2,468 before challenging the higher resistance level at $2,547.
Spot Ethereum ETFs Record $141 Million in Outflows
U.S. spot Ethereum ETFs recorded total net outflows of $141 million on September 15, according to SoSoValue data cited by Wu Blockchain. BlackRock’s ETHA accounted for approximately $97.97 million of those withdrawals, representing roughly 69% of the day’s total spot Ethereum ETF outflows. Wu Blockchain reported the data on X: https://x.com/WuBlockchain/status/2100155461408551108?s=20
Spot ETFs give investors exposure to ETH through a regulated, exchange-listed fund without needing to hold the token directly, which is why daily net-flow figures are widely used as a gauge of demand through traditional investment channels. Net outflows indicate that redemptions exceeded new investment during the session.
The withdrawals came as Ethereum fell back below $2,400 and tested lower intraday support. Bitcoin investment products also faced heavy redemptions during the same session. U.S. spot Bitcoin ETFs recorded $450 million in net outflows, while Fidelity’s FBTC saw approximately $215 million in outflows.
Combined, Bitcoin and Ethereum ETFs recorded about $591 million in net outflows during the session. Ethereum products accounted for almost one-quarter of that total. The timing coincided with weaker cryptocurrency prices following the stalled CLARITY Act vote.
Ethereum’s decline toward $2,360 also drew attention to whether ETF selling would continue in the next trading session.
ETH Technical Levels and Analyst Forecasts
Ethereum is trading near its 50-week exponential moving average at $2,382. That level could determine whether the recent recovery structure remains intact. Weekly moving averages at this timescale are followed by longer-horizon traders because they smooth out volatility and are commonly used to judge whether a broader trend structure is still holding.
A weekly close below the 50-week EMA could expose the first major support area near $2,225, representing a decline of roughly 8% to 10% from current levels. Below $2,225, the next major support areas for ETH are around $1,965 and $1,713. These levels would become relevant if selling pressure extended beyond the current range.
Crypto analyst Crypto Patel also identified a broader downside path if ETH fails to recover above higher resistance. His stated levels are $2,143, $2,000, $1,870, and $1,800. Crypto Patel posted his analysis on X: https://x.com/CryptoPatel/status/2100155231786979353?s=20
On the upside, Ethereum needs to reclaim $2,547 before its short-term structure improves. A break above that level could bring the $2,800 resistance area back into focus.
This article is for informational purposes only and does not constitute financial or investment advice. Cryptocurrency investments involve risk, and ETF flows or technical targets do not guarantee future price performance.

