Ethereum Price Drops 32% From September High as TD Sequential Buy Signal Hints at Recovery
Key Takeaways
- •Ethereum fell 32.40% from $2,806 on September 21 to $1,897 in November, erasing the gains from the late-summer rally and slipping beneath its descending channel.
- •A TD Sequential nine-count buy signal appeared on the daily timeframe, a setup that can precede a rebound but does not confirm the decline has ended.
- •Momentum indicators sit in oversold territory, with the daily RSI at 24.48 and the two-day indicator near 32, reflecting stretched selling and weak momentum.
- •The $1,850 to $1,950 area is regarded as the final major support zone, and a break below it would expose the weekly lower Bollinger Band near $1,597.
- •Whale traders increased bullish exposure during the selloff, with top-trader long/short ratios of 1.82 on Binance and 2.11 on OKX, while about 36% of ETH's supply was staked as of November 13.
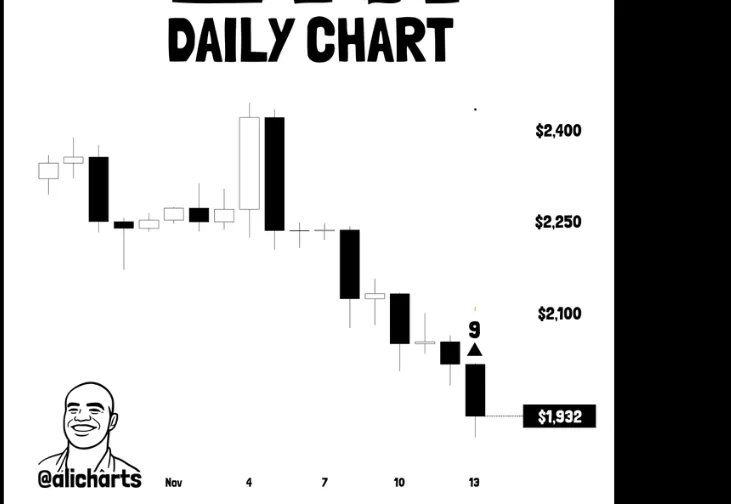
Ethereum has fallen 32% from its September high, pushing the price back below the $2,000 level and returning attention to a major support zone between $1,850 and $1,950.
ETH traded near $1,930 on Friday after touching $1,897 during the decline. A TD Sequential buy signal has now appeared on the daily timeframe, although sellers still control the broader market trend, leaving traders to weigh the signal against a structure that remains under selling pressure.
Buy Signal Follows a 32% Decline
Ethereum dropped 32.40% from $2,806 on September 21 to $1,897 in November. The decline erased the gains from the late-summer rally and pushed ETH below a descending channel. The top altcoin also slipped beneath several daily moving averages, leaving resistance stacked above its current trading range.
On the daily chart, the TD Sequential indicator, which counts consecutive candles to time potential reversals, printed a nine-count buy signal, a setup analyst Ali (@alicharts) highlighted in a post on X. The setup completes once nine consecutive candles meet the indicator's conditions. Traders use the indicator to identify potential exhaustion after sustained price movements. A buy signal can precede a rebound, but it does not confirm that the decline has ended.
Momentum readings point in the same direction. The daily relative strength index (RSI) stood at 24.48, below the conventional 30 threshold for oversold readings, while the two-day indicator registered a reading near 32. Both sit in oversold territory, a condition commonly associated with stretched selling, and reflect weak momentum, with the shorter timeframe registering greater selling pressure.
Merlijn The Trader compared the current setup on X with Ethereum's correction in 2025. During that earlier period, ETH briefly lost support near $2,100 before recovering toward $3,700.
Resistance Stacked Above $2,000
Ethereum must first recover the $2,000 level to challenge the immediate overhead barriers. The former channel boundary near $2,115 stands just above that mark, while a separate technical projection identifies the 200-day simple moving average around $2,150 as another potential recovery test.
On the weekly timeframe, the middle Bollinger Band sits near $2,232. The latest weekly candle is trading below this level, and a marked resistance zone stretches across $2,130 to $2,230. A stronger advance would bring the descending resistance line near $2,435 into view.
Support remains concentrated around $1,873, close to the lower edge of the latest trading range. Ted Pillows noted on X that the $1,850 to $1,950 area is the final major support zone before lower cycle levels. A break below that region would expose the weekly lower Bollinger Band near $1,597, a level that shifts as new price data arrives. Whether that band holds, and whether buyers can lift ETH back above $2,000, are the immediate reference points for judging whether the daily buy setup develops follow-through.
Whale Long Positions Rise During the Selloff
Large derivatives traders have increased their bullish exposure despite the price decline. Analyst CW reported on X that Ethereum's Whale vs Retail Delta crossed 0.6, indicating a widening gap between the positioning of large and smaller traders.
Exchange positioning data showed the same tilt: among top traders, long accounts outnumbered short accounts, with Binance recording a long/short ratio of 1.82 and OKX at 2.11 (ratios above 1 indicate more long than short accounts).
Network data, meanwhile, placed Ethereum's staked supply near 36% — roughly one-third of ETH's supply — on November 13. Staked assets help secure the network and remain distinct from traders' leveraged positions.
Source: The Market Periodical

