Ethereum Loses July Recovery Channel, Falls Below $1,900
Key Takeaways
- •Ethereum has traded outside its former rising channel for five consecutive daily sessions after breaking down on July 23.
- •The latest rejection occurred near $1,950, pushing price back toward support around $1,870.
- •Coinglass reported $98.8 million in Ethereum liquidations over 24 hours, with $76.9 million coming from long positions.
- •Ethereum’s OI-weighted funding rate fell below zero, indicating leveraged positioning has shifted slightly toward shorts.
- •Futures recorded a three-day net inflow of $284 million, while spot flows still showed a 12-hour net outflow of $30.7 million.
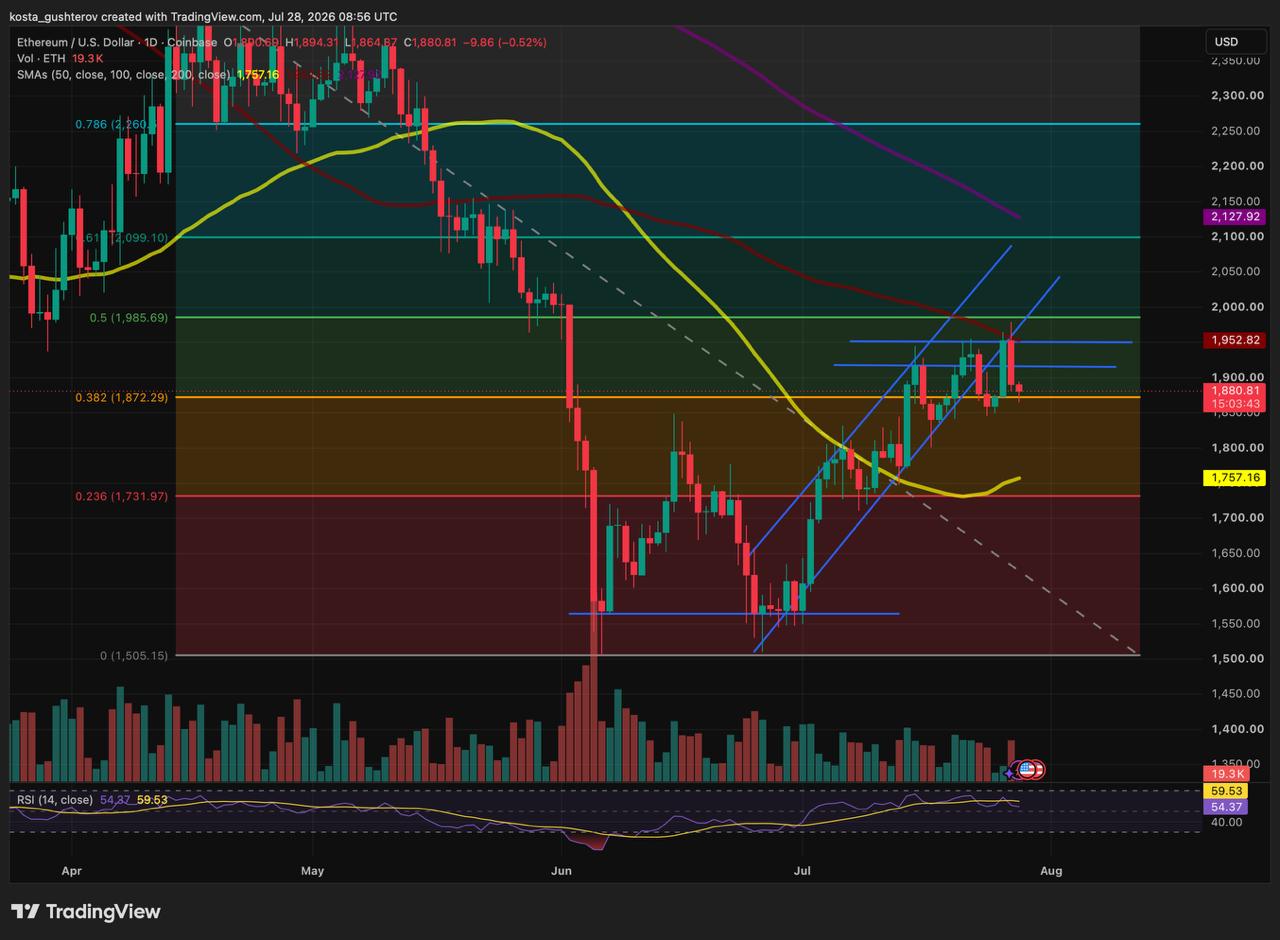
Ethereum lost its rising channel on July 23 and has now stayed outside that structure for five consecutive daily sessions. Recent rebounds have tested the former lower boundary from below, but buyers have not been able to push price back inside the channel.
The latest rejection also came from the $1,950 area, just below the 100-day simple moving average near $1,950. That has returned Ethereum to the 0.382 Fibonacci support around $1,870, leaving traders focused on whether the current base can hold after repeated failed retests.
The Broken Channel Has Turned Into Resistance
The channel breakdown is now confirmed. The former lower boundary has shifted from support to resistance, creating another barrier above the current price.
If $1,870 holds, Ethereum could make another attempt at $1,950. A move above that level would give buyers a chance to recover the broken channel and retest $1,950, followed by the 100-day SMA and the 0.5 Fibonacci retracement near $1,980.
A daily close below $1,870 would expose the 0.236 retracement near $1,730.
Long Traders Accounted for Most of the Liquidations
Coinglass recorded $98.8 million in Ethereum liquidations over the past 24 hours. Long positions made up $76.9 million of that total, while short liquidations reached $21.9 million.
The imbalance shows that the rejection forced heavily positioned bullish traders out of the market. Clearing that leverage can reduce immediate liquidation pressure, but price still needs fresh demand before any recovery can take shape.
Ethereum’s OI-weighted funding rate also moved below zero after remaining positive through much of July. Because the metric gives more weight to markets with larger open positions, the shift suggests leveraged positioning has tilted slightly toward shorts.
That reduces the earlier concentration of long bets and could support a rebound if shorts are forced to close. Negative funding, however, does not by itself show that buyers have returned.
Futures Exposure Returns While Spot Demand Remains Weak
Ethereum futures posted a three-day net inflow of $284 million after a seven-day net outflow of $676 million.
The return of futures capital shows that traders are rebuilding exposure after the previous week’s reduction. More leverage could amplify the next move, especially while ETH remains below its former channel.
Spot flows have provided less support. Coinglass recorded a 12-hour net outflow of $30.7 million, although the one-hour, four-hour and eight-hour readings had turned positive.
Some buyers have stepped in near the current price, but those shorter inflows have not yet offset the broader 12-hour withdrawal. That helps explain why ETH has stabilized near $1,880 without regaining the resistance above it.
The Broader Chart Has Improved, but Not Fully Reversed
On a wider timeframe, Ash Crypto posted on X that Ethereum has moved above a descending trendline that had capped price for roughly 11 months. That break improves the longer-term picture and could support sentiment across the altcoin market.
Still, it does not confirm a full reversal. ETH remains below its 100-day and 200-day moving averages, with the 200-day average near $2,130, and it continues to trade beneath the broader downtrend from its multi-year high.
The immediate question is whether Ethereum can recover $1,950 and reclaim the broken July channel from below. Failure to do so would keep the breakdown active, while a close below $1,870 would shift attention toward $1,730.
Disclaimer: This article is for informational and analytical purposes only and does not constitute financial or investment advice. Technical levels, derivatives positioning and market flows do not guarantee future price movements.
Methodology: Ethereum price levels and technical indicators are based on the ETH/USD daily chart from TradingView using Coinbase data. Liquidations, futures flows, spot flows and the OI-weighted funding rate come from Coinglass. The 11-month trendline view comes from the chart published by Ash Crypto.

