Ethereum Price Analysis: Can ETH Hold $1,853 as Weekly Losses Hit 10%?
Key Takeaways
- •Ethereum traded at $1,906.61 on November 14, representing a 10.38% weekly decline after touching $2,160.50 earlier in the week.
- •The current correction started after Ethereum failed to break above $2,807, and the weekly chart has since printed lower highs and lower lows.
- •A weekly close below the $1,853.62 support, followed by a failure to reclaim it, could extend selling toward the $1,385–$1,571 region.
- •Ethereum is trading below its 50-week and 200-week simple moving averages, positioned at $2,279.90 and $2,559.77, reinforcing the bearish weekly trend.
- •The weekly candle was still open at the time of analysis, making the weekly close the next key checkpoint for confirming either a breakdown or a support hold.
Ethereum Price Analysis: Can ETH Hold $1,853 as Weekly Losses Hit 10%?
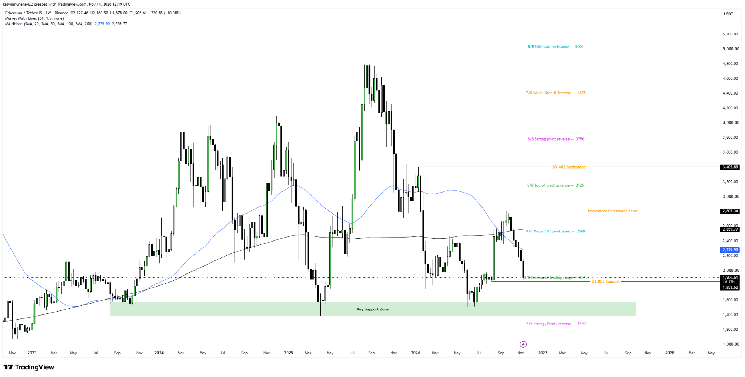
Ethereum ($ETH) was trading at $1,906.61 on November 14, down 10.38% for the week, according to TradingView data. The asset had reached $2,160.50 earlier in the week before falling to $1,878.
The decline extends a correction that began after Ethereum failed to break above $2,807. Since that point, the weekly chart has registered a series of lower highs and lower lows — the pattern technicians use to define a downtrend — shifting attention to the support levels situated just below the current price.
Further Losses Possible Below $1,853 Support
The first level to watch is $1,875, which marks the lower end of the trading range on the Murrey Math indicator, a technical framework that maps price action onto a fixed grid of evenly spaced support and resistance levels. A second support level sits slightly lower at $1,853.62. If Ethereum closes the week below $1,853 and subsequently fails to reclaim it, selling could extend toward the $1,385–$1,571 region.
That zone has held up against selling pressure on previous occasions. Ethereum recovered from this area in 2025 and eventually traded above $4,800, and buyers returned to the same region in 2026, driving a recovery toward $2,807. The asset has, however, lost roughly 60% of its value from the $4,800 area — a drawdown that shows how far the current correction has traveled within that historical range. Below the historical support zone, the Murrey Math indicator places another potential reversal level at $1,250.
ETH Trades Below Key Moving Averages as Momentum Weakens
The weekly chart also shows Ethereum trading below its 50-week and 200-week simple moving averages, positioned at $2,279.90 and $2,559.77 respectively. Averages of this length are widely watched as long-term trend benchmarks, so price action beneath both underscores the bearish weekly structure. The shorter average continues to slope downward and could present resistance should a recovery materialize.
Further up, the $2,500 Murrey Math pivot sits close to the 200-week average near $2,560. Additional resistance is located at $2,807.34, where the previous recovery stalled. A break above that level could bring $3,125 into play, with another horizontal resistance level at $3,402.89.
Outlook Depends on Weekly Support Retention
Ethereum currently remains above the $1,853–$1,875 support region. If buyers defend this area, the cryptocurrency could consolidate or attempt a recovery toward $2,279. Conversely, trading below $1,853 for an extended period could leave the asset exposed to a deeper correction.
The weekly candle was still open at the time of the analysis, meaning a breakdown had yet to receive confirmation — making the weekly close the next checkpoint for whether the bearish scenario strengthens or the support region holds.
Key Scenarios
- Bullish case: If buyers hold $1,853, Ethereum could work its way back toward $2,279 and later test $2,500.
- Bearish case: A weekly close below $1,853 could bring the $1,385–$1,571 demand zone into focus.
- Neutral case: Ethereum could spend more time trading around $1,853–$1,875 without establishing a clear direction.
Ethereum Price FAQs
Is selling pressure affecting Ethereum? Selling pressure continues to weigh on $ETH, while its weekly market structure remains bearish.
Where is the immediate support? The immediate horizontal support sits at $1,853.62.
Could the price fall further? That remains possible if $ETH breaks below $1,853 and fails to recover.
What would improve the technical outlook? A recovery above the weekly moving average at $2,279.90 could improve the technical picture.

