Ethereum Price Prediction: Can ETH Clear the 100-Week SMA and Reach $3,400?
Key Takeaways
- •Ethereum broke above the $2,464 change-of-character level and climbed to roughly $2,806, its highest price since late January.
- •The token is pressing against its 100-week simple moving average near $2,762, while the current weekly candle's provisional close sits near $2,728.
- •A weekly close above the moving average could open a path through the $2,900–$3,055 liquidity zone toward resistance charted near $3,400–$3,447.
- •A rejection from the average would shift attention to the $2,550–$2,560 support area, with deeper levels identified near $2,190 and between $1,900 and $2,100.
- •ETH gained approximately 12–14% over the past seven days, trading near $2,749 according to CoinGecko data.
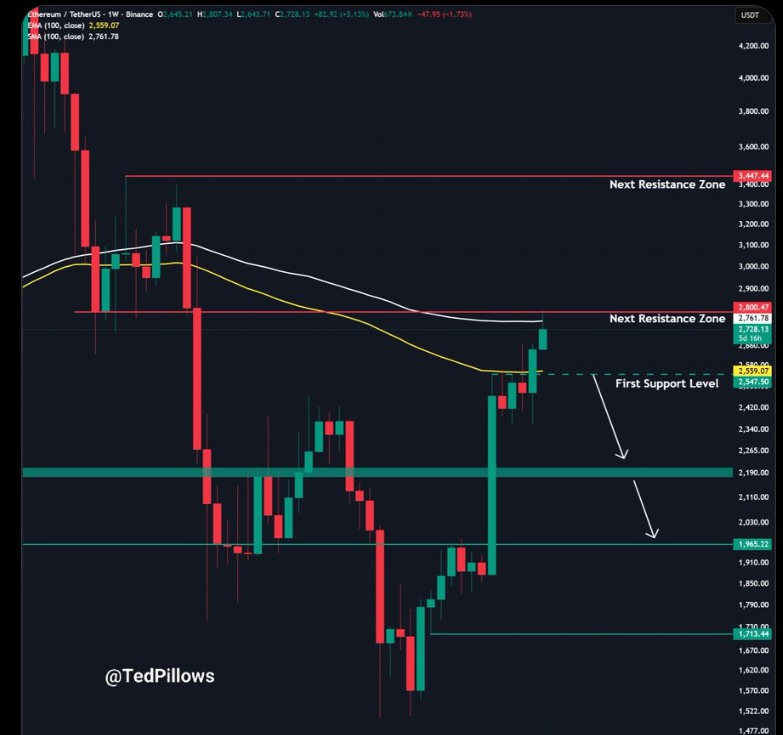
Ethereum price tested the $2,800 resistance zone after breaking above the key $2,464 market structure level, trading near $2,750 on Sept. 23 as the token pressed against a major weekly moving average. CoinGecko showed ETH around $2,749, with the seven-day trading range extending as high as $2,804.42 and the cryptocurrency gaining about 13.9% over the same period. The performance left ETH within striking distance of the weekly moving average that has defined recent resistance.
The weekly chart places Ethereum just below its 100-week simple moving average (SMA) near $2,762. A long-term trend gauge that averages the past 100 weeks of closing prices, the SMA is the kind of level where intraday spikes count for less than where the week finally settles. A weekly close above that area would strengthen the technical structure and could open the path toward the $3,400 resistance zone, while rejection would shift attention back toward the $2,550–$2,560 support region.
Ethereum Presses the 100-Week SMA
Ethereum's latest recovery has brought the price into a decisive area on the higher-timeframe chart, where the 100-week SMA is the level analysts are watching most closely. ETH climbed to about $2,807 before pulling back toward $2,725–$2,730, taking price directly into a major weekly resistance cluster. The 100-week SMA sits near $2,762, while the chart marks an additional resistance level around $2,800.
Analyst Ted Pillows said the Ethereum weekly close will define the next move. His chart places the 100-week EMA near $2,559, a faster support line that ETH currently holds above. In his view, a weekly close above the 100-week SMA would strengthen the case for a continued recovery toward the upper resistance zone.
The current weekly candle opened near $2,645 and traded as high as $2,807 before easing, leaving the provisional close near $2,728 — roughly $34 below the 100-week SMA shown on the chart. Ethereum therefore needs more than an intraday break to confirm strength above the average: a weekly candle is only complete once the week ends, so the final close is what validates the level.
Breakout Alters the Market Structure
The four-hour chart shows ETH breaking above the $2,464 change-of-character level, which analyst Crypto Patel identifies as the point where the previous bearish structure lost control. Ethereum then extended to roughly $2,806, its highest level since late January, underscoring the strength of the recent recovery.
The chart also traces a sequence of higher lows after ETH recovered from the June low near $1,500 — the pattern chartists read as a trend regaining upward structure, with each pullback finding a floor above the previous one. Buyers defended the $1,800–$1,900 region before price moved through $2,464 — a level that now becomes important again should ETH pull back from current resistance.
Liquidity Builds Near $3,000
The next charted resistance sits between $2,900 and $3,055. Crypto Patel marks this area as a bearish order block and liquidity zone that ETH must clear before the chart opens room toward the higher $3,400 area. Zones of this kind are charted where orders are expected to cluster, which is why they are treated as decision points for the trend rather than ordinary price levels.
The weekly chart places the next major resistance around $3,447, a level that closely matches the $3,300–$3,400 target in Ted Pillows' Ethereum price prediction. The two charts point to a similar upside region, though both require ETH to clear nearby resistance first.
The chart also keeps $2,800 as a separate horizontal barrier. ETH tested that area but has yet to establish a sustained close above it. A move through both $2,762 and $2,800 would remove two nearby resistance points, shifting the next technical focus toward the $2,900–$3,055 supply area.
Trading data also shows stronger activity around the latest move. Ethereum gained about 12% over the last seven days according to the data cited alongside the charts. The wider trading range shows ETH tested resistance, while the retreat toward $2,730 kept the price close to the weekly moving-average cluster, leaving the outcome of the weekly close finely balanced. With the candle still open, the end-of-week close is the next scheduled checkpoint for resolving that balance.
$2,550 Support Defines the Near-Term Risk
The first downside level sits around $2,550–$2,560. The weekly chart places the 100-week EMA near $2,559 and marks support close to $2,548 — a zone that could return to focus if ETH is rejected from the 100-week SMA.
Below that, the weekly chart shows another support band near $2,190. The four-hour chart also marks a fair value gap around $2,053 and stronger support near $1,907. Crypto Patel places the deeper retracement area between $2,100 and $1,900.
This article is for informational purposes only and does not constitute financial or investment advice. Technical levels and analyst projections do not guarantee future price movements.
This article was originally published on The Market Periodical.

