Ethereum MVRV Golden Cross Nears as Analysts Track ETH Price Zones
Key Takeaways
- •Ethereum's MVRV ratio is approaching a golden cross above its 160-day simple moving average, a pattern that has historically coincided with major ETH recovery phases.
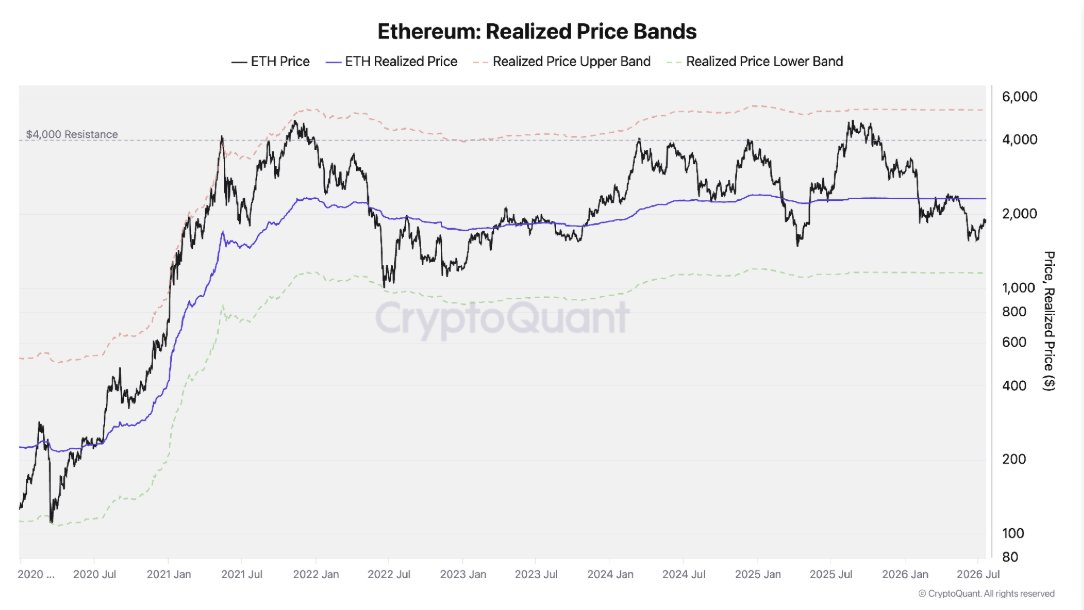
- •ETH trades approximately 17% below its realized price of $2,304, meaning the average holder is underwater—a condition that has typically discouraged further selling in past cycles.
- •CryptoQuant reports that two of five bottom-tracking signals have reached bottoming levels, while the remaining three indicators continue to show improvement.
- •The ETH/BTC exchange inflow ratio has declined from a peak above 1.5 to roughly 0.8, suggesting reduced selling pressure from Ethereum holders relative to Bitcoin holders.
- •Trader Ted Pillows identified a liquidity cluster between $1,870 and $1,900 that could be swept, with the $1,980 to $2,000 range as a subsequent upside target.
Ethereum is approaching a closely watched technical signal on its MVRV ratio, while analysts are also tracking key liquidity levels as ETH trades below its realized value. The confluence of on-chain metrics flashing potential bottom signals comes at a time when Ethereum's competitive position relative to Bitcoin has weakened throughout 2025, making these indicators particularly relevant for traders assessing whether the current downtrend is nearing exhaustion.
The token's MVRV (Market Value to Realized Value) ratio — which compares Ethereum's market capitalization to the aggregate cost basis of all circulating coins — is nearing a crossover above its 160-day simple moving average, a pattern analysts describe as a golden cross. When MVRV sits below 1, as it does when market price is below realized price, it signals that the average holder is underwater, a condition that has historically preceded recovery phases. Traders have previously associated similar setups with turning points for ETH. The latest signal comes as Ethereum trades near $1,900, remaining below levels reached earlier this year.
Ethereum MVRV Ratio Approaches Golden Cross
Analyst Ali Charts flagged the developing pattern on X, noting that the MVRV Momentum indicator measures the relationship between aggregate holder profitability and its medium-term trend line.
ETHEREUM: GOLDEN CROSS Ethereum is approaching a bullish crossover on its MVRV ratio against its 160-day SMA. The MVRV Momentum tracks the relationship between aggregate holder profitability and its medium-term trend line. When the daily MVRV ratio breaks back above its 160-day… pic.twitter.com/RMIe2OA1rG — Ali Charts (@alicharts) July 23, 2026
https://x.com/alicharts/status/2080222487455920517?ref_src=twsrc%5Etfw
A move above the 160-day SMA is often viewed by chart watchers as a possible shift away from capitulation conditions. It can also indicate renewed accumulation among holders. Over the past three years, similar crossovers have coincided with major recovery phases for ETH.
Those prior instances followed extended periods in which sellers dominated market activity. The current setup comes after months of weak price action across Ethereum.
ETH Traders Watch Liquidity Between $1,870 and $1,900
Trader Ted Pillows pointed to a liquidity cluster forming around the $1,870 to $1,900 range. He said Ethereum could sweep that area as markets show early signs of correction.
According to Ted, a move through that zone could bring attention to the $1,980 to $2,000 area. He described that upper range as worth watching after any liquidity sweep takes place.
$ETH has formed a liquidity cluster around the $1,870-$1,900 level. With markets showing slight correction, Ethereum could sweep this liquidity zone. But after this, a rally towards $1,980-$2,000 would start to look interesting. pic.twitter.com/WgCRSxE2qf — Ted (@TedPillows) July 23, 2026
https://x.com/TedPillows/status/2080212823368450428?ref_src=twsrc%5Etfw
CoinGecko data showed ETH at $1,898.54 at the time of writing. Trading volume over the previous 24 hours totaled $9.53 billion. The token was down 1.10% on the day, while still showing a 1.61% gain over the past week.
CryptoQuant Data Shows ETH Below Realized Cost Basis
CryptoQuant research indicates that Ethereum is trading below its realized cost basis. ETH is roughly 17% under its realized price of $2,304, placing it in the lower half of its realized price band. The realized price reflects the average on-chain acquisition cost across all wallets, meaning the broader Ethereum holder base is currently holding at a loss — a condition that has typically discouraged further selling in past cycles.
Historically, CryptoQuant said this area has aligned with market bottoms and stronger upside potential. The ETH/BTC MVRV ratio has also fallen sharply. After peaking near 0.95 in August 2025, it now stands around 0.65. That level remains above the 0.45 mark associated with prior ETH bottoms against Bitcoin. The ETH/BTC ratio is widely tracked as a barometer of Ethereum's relative strength versus Bitcoin, and its sustained decline reflects the broader market trend of capital concentration in Bitcoin over altcoins during the period.
Selling pressure between ETH and BTC also appears to have eased. The ETH/BTC exchange inflow ratio has declined from a spike above 1.5 to near 0.8. CryptoQuant noted that this reading is still above the 0.4 threshold observed at earlier lows. Exchange inflow ratios measure the relative pace of coins moving onto exchanges — a proxy for intent to sell — and a declining ratio suggests ETH holders are depositing fewer coins relative to BTC holders.
Institutional positioning is also showing early signs of change. The ETH/BTC ETF holdings ratio dropped to about 0.115 in June before recovering to 0.13. Weekly spot volume between the pair has also fallen significantly, moving from 1.75 to roughly 0.5. The ETF holdings ratio tracks the relative size of institutional exposure to Ethereum versus Bitcoin through regulated vehicles in the United States.
CryptoQuant said two of the five signals it tracks are now at bottoming levels, while the remaining indicators continue to improve.

