Ethereum Rallies 7% Into the $2,500 Ceiling: Key Levels to Watch
Key Takeaways
- •Ethereum jumped 7.35% to $2,442 on November 4, recording an intraday high of $2,450 and a $224 low-to-high range in a single session.
- •The rally carried price through the 0.382 retracement near $2,307 and left it about 3.5% above the 100-day moving average at $2,359.
- •A resistance band formed by the 0.236 Fibonacci level near $2,497 and the 50-day SMA at $2,509, which capped every October rebound, sits just above the session high.
- •The 14-day RSI climbed to 55.57, clearing its 50 midline and signal line after nearing oversold territory in late October, while the gap between the 100-day and 50-day averages narrowed from $171 to $150.
- •A daily close above $2,510 would clear both resistance levels and open the $2,700 consolidation area and $2,803 peak as targets, whereas a close below $2,226 would cancel the rebound structure.
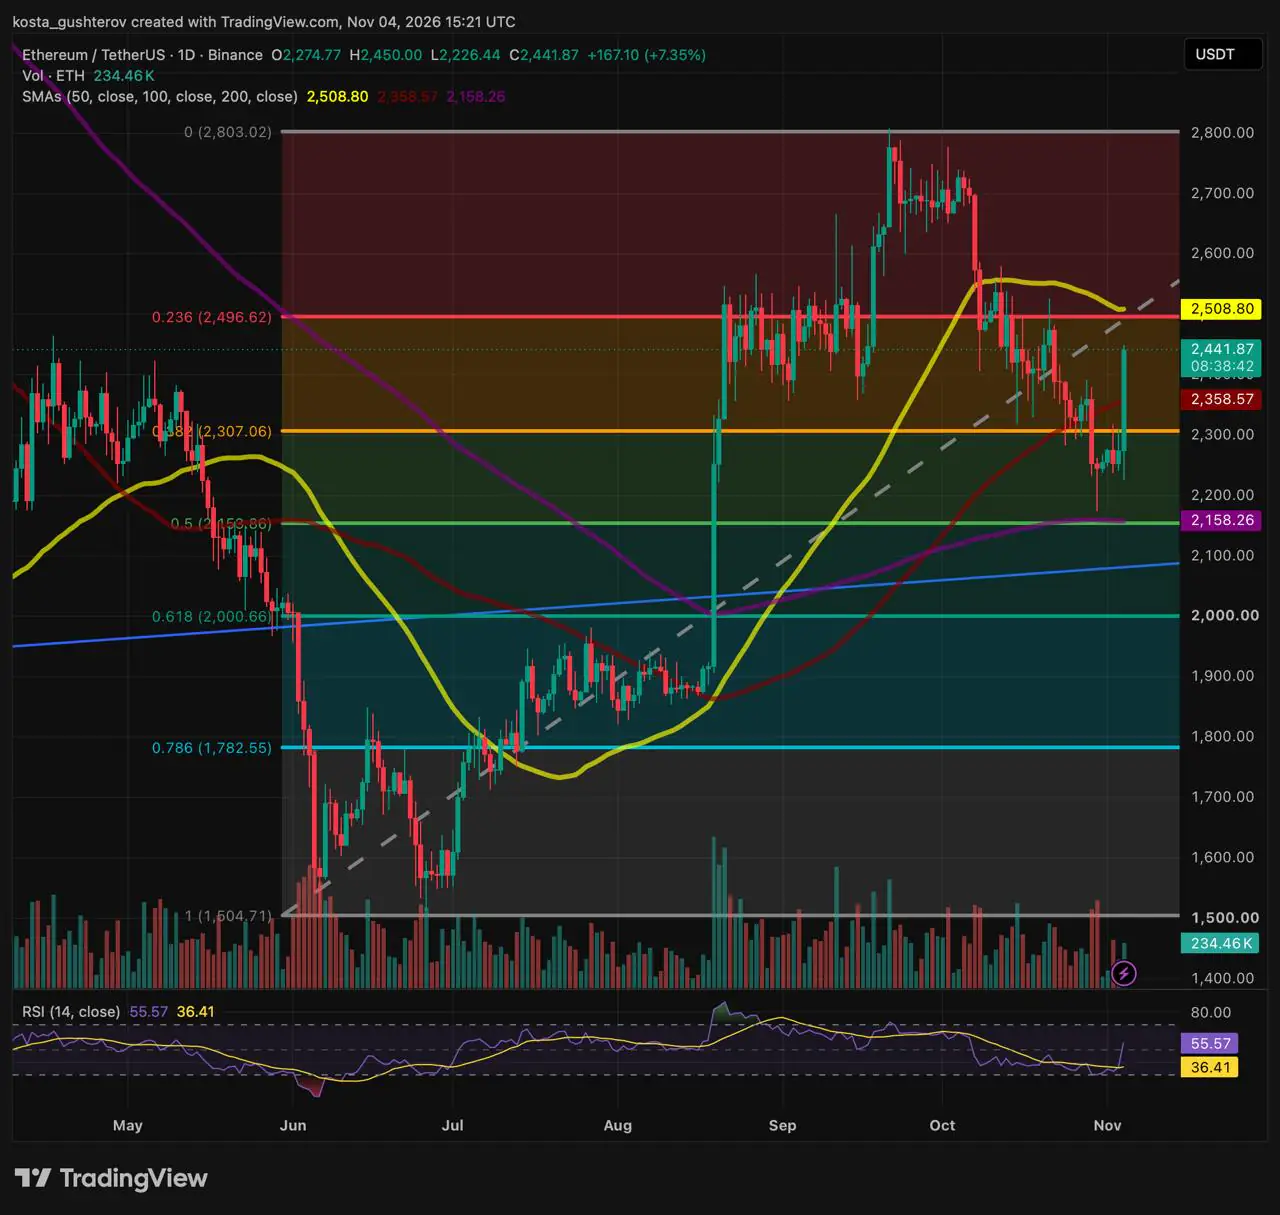
Ethereum (ETH) jumped 7.35% on November 4, changing hands at $2,442 as of 15:21 UTC — a gain of $167 on the session — according to TradingView's Binance ETH/USDT chart, a widely used reference pair for Ether's spot price. The intraday high of $2,450 brought the asset within reach of the 0.236 Fibonacci retracement near $2,497, a level that sits just $12 below the 50-day simple moving average (SMA) at $2,509, forming a dense overhead ceiling. Fibonacci retracements mark fixed percentages of a prior decline where recoveries often slow, and moving averages smooth recent closes into a trend gauge; when the two stack within a few dollars, chart readers typically treat the combined zone as a single decision area.
One Session Through the Broken Zone
Coindoo's November 1 analysis caught ETH just after a flush into the 0.500 Fibonacci level near $2,154 and the 200-day SMA. That review flagged the broken zone between the 0.382 retracement near $2,307 and the 100-day average as the first area to test. Today's candle covered that ground in a single session: it opened at $2,275, dipped to $2,226, then climbed through both levels, leaving ETH about $83, or 3.5%, above the 100-day SMA at $2,359.
That puts the day's range at $224 from low to high, and the candle still has hours to run. Whether the move above the 100-day average counts as a daily reclaim depends on the close — a convention that reflects how intraday extremes can appear and reverse within hours, while closing prices are what technicians use to confirm a level has been crossed.
What Moved Since November 1
Comparing snapshots taken at 16:48 UTC on November 1 and 15:21 UTC on November 4, the 14-day RSI climbed to 55.57, clearing both the 50 midline and its signal line at 36.41 after dipping close to oversold territory in late October. The RSI is a momentum oscillator scored from 0 to 100, with readings above 50 conventionally read as strengthening momentum and values approaching 30 marking oversold conditions. The moving averages tell a slower story: the 100-day kept rising while the 50-day kept sliding, narrowing the gap between them from $171 to $150 — a sign that October's selling still weighs on the shorter average.
The Band Where October's Rebounds Stalled
The 0.236 retracement around $2,497 and the 50-day SMA at $2,509 lie only $12 apart. ETH consolidated across this resistance band from late August to mid-September, broke down through it in October, and has stalled around it on each rebound since. On the higher timeframe, the November 1 analysis placed the 50-month average at $2,471, just beneath the band.
The session high of $2,450 stopped $47 short of the 0.236 level and finished below that monthly line as well; ETH trades about 2.2% under the Fib. The 50-day half of the ceiling is drifting down toward price, while the Fib level stays put. Above the band, the chart shows a second consolidation area around $2,700 from late September and early October, along with the cycle peak at the 0 Fib near $2,803.
A one-day 7% run into the 50-day average is also how October's rebounds looked before they stalled. If the band holds again, this move would mark a lower high beneath October's peak.
Checkpoints for the Next Closes
Three outcomes, each defined by where ETH closes. The nearest test is the 100-day SMA at the 00:00 UTC close.
A pullback that holds. A controlled dip that stays above the 0.382 level near $2,307 and the 100-day SMA would set a higher low beneath the ceiling and keep a second attempt at $2,500 open. A daily close back below $2,226 — today's low — would cancel the rebound structure.
The band turns price back. Exhaustion wicks, fading volume, or a bearish engulfing candle inside the band would point to a lower high. A rotation from there could run back through $2,307 toward the 0.500 level near $2,154 and the 200-day SMA at $2,158, the floor tested at the end of October. Sustained daily acceptance above $2,520 to $2,550 would rule this path out.
Buyers take the ceiling. A daily close and acceptance above $2,510 would clear both the 0.236 level near $2,497 and the 50-day SMA. That would leave the $2,700 consolidation area and the $2,803 peak as the next references above.
The Wider Frame
The 0.500 and 200-day cluster remains the line for the broader uptrend. Beneath it, the 0.618 retracement near $2,001 lies next to the round $2,000 mark, with the rising trendline around $2,080 just above.
This article is provided for informational purposes only and does not constitute financial or investment advice. Technical levels and scenarios do not guarantee future price movement. This article was first published by Coindoo.

