Ethereum Nears $2,700 as Fund Holdings Recover but Sentiment Weakens
Key Takeaways
- •Tracked Ethereum fund holdings climbed roughly 23% to 24% from July, rising from about 5.45 million ETH to around 6.7 million ETH.
- •U.S. spot Ethereum ETFs recorded approximately $64.7 million in net outflows on October 2, according to Lookonchain.
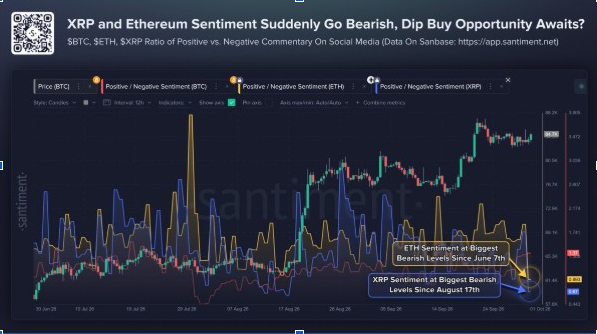
- •Santiment data showed Ethereum's positive-to-negative social commentary ratio dropping to 0.89, its lowest level since June 7.
- •ETH open interest approached $30 billion in late September, while about $426.9 million in ETH options expired on October 2 with max pain near $2,675.
- •The monthly chart identifies $5,000 as Ethereum's primary long-term resistance, with a decisive breakout and hold above it potentially opening resistance areas near $6,800 and a projection toward $8,800.
Ethereum traded near $2,700 as recovering fund holdings contrasted with increasingly bearish social sentiment. Tracked Ethereum fund balances have rebounded by about 23% to 24% from July levels, reaching approximately 6.7 million ETH, while U.S. spot ETH exchange-traded funds recorded fresh outflows on October 2.
Technical analysts continue to monitor $5,000 as Ethereum’s main long-term resistance level. The asset must break and hold above that threshold before an analyst’s technical projection toward $8,800 becomes active.
Ethereum Fund Holdings Recover Despite Uneven Flows
ETH changed hands near $2,700 after gaining about 0.6% over 24 hours. Intraday trading remained relatively contained: Ethereum found support near $2,671, moved above $2,730, and later settled around the $2,700 area.
The broader recovery has been supported by renewed exposure across tracked investment products, although the pace has varied between sessions. Fund holdings increased from roughly 5.45 million ETH in July to about 6.7 million ETH. That represents growth of approximately 23% to 24% in the underlying coin holdings, rather than an increase attributable only to price appreciation. Tracked balances of this kind are often read as a gauge of structural demand, because they measure coins held in investment vehicles rather than trading activity on exchanges.
The recovery has brought fund exposure closer to its October 2025 peak. However, recent flows have not followed a straight line. Ethereum ETFs recorded about $64.7 million in net outflows on October 2, according to Lookonchain. Daily flow figures are among the most closely watched indicators of institutional appetite for spot ETH exposure in U.S. markets. Earlier demand had been considerably stronger, with Ethereum ETF flows having supported ETH near $2,400 in September.
Open Interest and Social Sentiment Diverge
The recovery in Ethereum fund holdings has occurred alongside a wider rebound in derivatives activity and market positioning. ETH open interest approached $30 billion in late September as traders increased exposure during the latest price recovery. Open interest, which captures the total value of outstanding derivative contracts, is commonly used as a measure of leverage and trader commitment.
Options activity also remained elevated ahead of the October 2 expiry. Bybit and Binance had approximately $426.9 million in ETH options notional expiring, with max pain near $2,675 — the price at which the largest number of options contracts would expire worthless, a level frequently referenced around large expiries.
At the same time, social sentiment weakened sharply as October began. Santiment data showed Ethereum’s positive-to-negative commentary ratio falling to 0.89, its lowest level since June 7. A ratio below one indicates that negative commentary exceeded positive commentary across major social platforms.
The reading does not confirm a price reversal, but it indicates that traders remained cautious despite the improvement in fund holdings. The divergence between positioning and sentiment followed an earlier period in which Ethereum short positions reached a 51-month high. ETH nevertheless remained near $2,670 at that time despite the increase in bearish positioning.
$5,000 Remains Key Technical Level
Ethereum’s monthly chart identifies $5,000 as the primary long-term resistance level. ETH has tested that region during previous cycles but has sustained a monthly breakout above it. Monthly closes are typically used by long-term chart analysts to filter short-term noise, which is why the projection is tied to monthly rather than daily candles.
The analyst’s bullish scenario depends on Ethereum closing decisively above $5,000 and holding that level. If that condition is confirmed, the chart identifies the next resistance area near $6,800, followed by a possible move toward $8,800.
These levels are a long-term technical projection, not a near-term price target. Ethereum remains well below $5,000, meaning the required breakout has not occurred.
On shorter timeframes, ETH remains near $2,700 after recovering from September support around $2,400 to $2,500. The immediate structure would improve if buyers maintained the recovery and continued absorbing selling pressure. The broader monthly range still places major downside support near $1,200.
From here, the observable markers are concrete: whether daily ETF flows turn positive again, whether the Santiment ratio climbs back above one, and whether ETH holds the $2,700 area that has framed recent sessions — with the $5,000 monthly threshold remaining the line between the current range and the long-term projection.
Until ETH clears $5,000, the $8,800 projection remains conditional on a breakout that has yet to occur. This article is for informational purposes only and does not constitute financial or investment advice. Fund-flow data, sentiment indicators, and technical price projections do not guarantee future market performance.

