Ethereum Erases August Breakout as Price Tests $2,000
Key Takeaways
- •Ethereum dropped 4.61% to $2,037 with an intraday low of $2,006 on Tuesday, following the October CPI report that also preceded Bitcoin's dip under $74,000.
- •Because the late-August rally crossed the $2,000-$2,500 zone in only two candles, the price fell through the entire August range in four sessions with little prior trading volume to provide support.
- •ETH logged a second consecutive daily close below its 200-day moving average at $2,154 and broke a multi-year trendline near $2,090, leaving the 50-day, 100-day, and 200-day averages stacked as overhead resistance.
- •The 14-day RSI fell to 28.84, the first sub-30 daily reading since June, marking oversold momentum as price tested the 0.618 Fibonacci retracement near $2,001.
- •A daily close below $2,001 would invalidate the August base and expose the 0.786 retracement near $1,783, while holding the $2,006 low sets a recovery target at the 200-day average around $2,154.
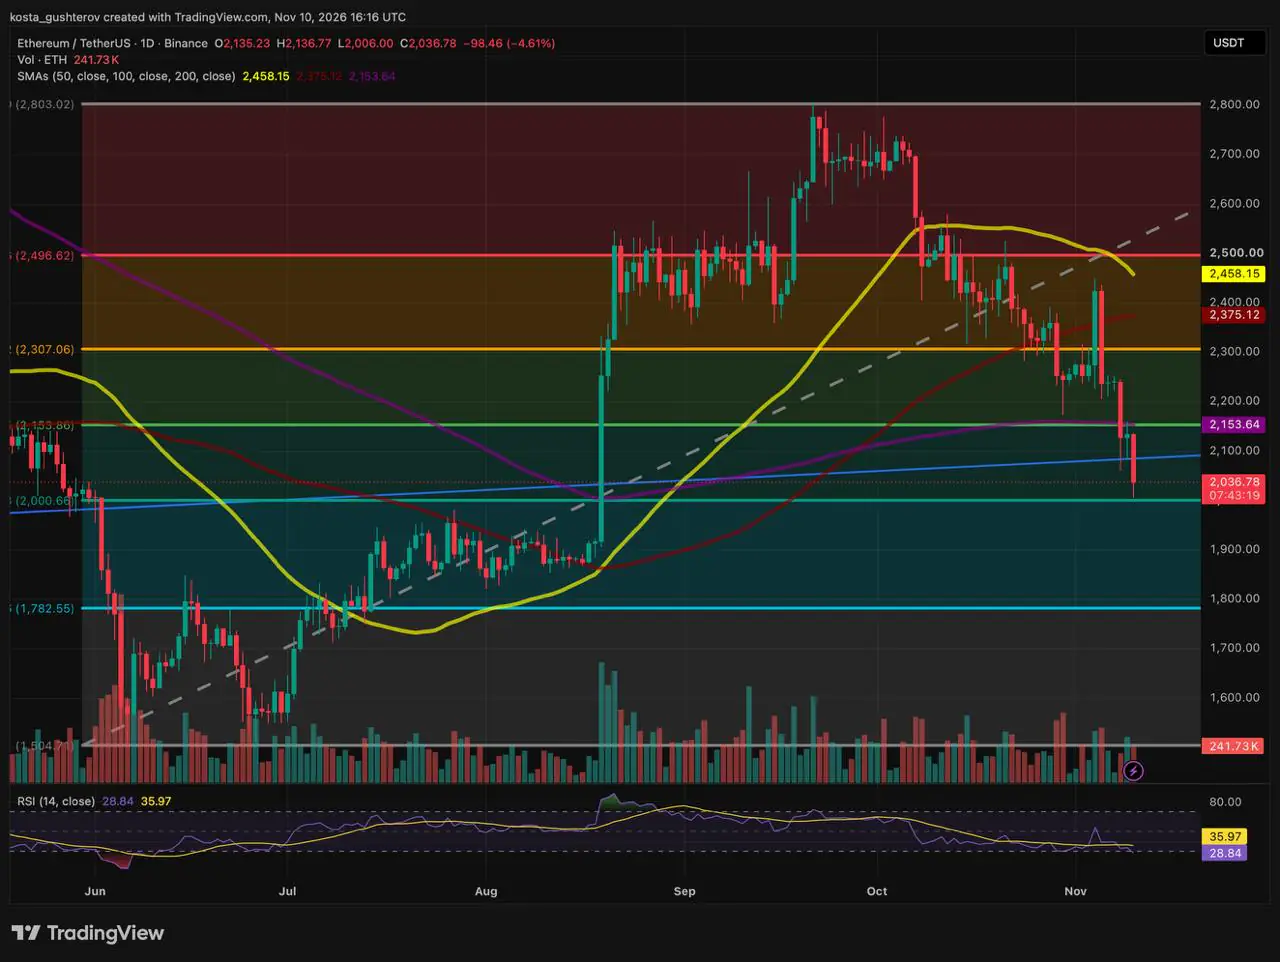
Ethereum (ETH) fell 4.61% to $2,037 on Tuesday, touching an intraday low of $2,006, in a broad cryptocurrency sell-off that followed the release of the October CPI inflation report — the same print that preceded Bitcoin's dip under $74,000. The decline erased the gains from the late-August breakout and returned ETH to the top of the range it occupied before that move. The consumer price index, the headline US inflation gauge published by the Bureau of Labor Statistics on a fixed monthly schedule, is one of the macro data points crypto traders track on the calendar. Unless otherwise noted, the readings below are taken from the Binance daily chart at 16:16 UTC.
The August gap has been filled
The late-August rally left almost no trading record between $2,000 and $2,500: ETH crossed that distance in two candles with little two-way activity in between. When the 0.382 Fibonacci retracement near $2,307 gave way last Thursday, there was no shelf of prior trading underneath it, and price went on to fall through the entire August range in four sessions.
The retracement levels cited throughout run from the June low near $1,505 to the late-September high near $2,803 — the same range used in Coindoo's earlier Ethereum analyses. Fibonacci retracements are percentage levels projected off a prior swing, keyed to ratios such as 0.382, 0.5, 0.618 and 0.786, that chartists use to flag potential support and resistance zones.
What broke, and when
The structural damage began before this week. Throughout October, ETH printed lower highs and lower lows and slipped below the white dashed line that had tracked the summer advance. What gave way this week were the last two supports beneath it.
Monday's close was the second in a row beneath the 200-day simple moving average (SMA) at $2,154, which sits on top of the 0.5 retracement at the same price. The 200-day SMA is one of the most widely followed trend gauges in charting, with daily closes on either side of it commonly used to separate longer-term uptrends from downtrends. On Tuesday it was the turn of the blue trendline rising through the June and August lows — the multi-year line that held Sunday's wick to $2,060. ETH opened at $2,135, reached no higher than $2,137, and cut through the line near $2,090 without pausing.
Why the fall stopped at $2,006
The 0.618 retracement near $2,001 marks the top of the range ETH built through August before its breakout, and Tuesday's low came within about $5 of it. The round number at $2,000 adds its own weight.
Momentum reached that floor already stretched. The 14-day relative strength index (RSI), a momentum gauge that compares the size of recent gains to recent losses on a scale from 0 to 100, reads 28.84 — below the 30 threshold that signals oversold conditions, under its signal line at 35.97, and beneath 50 since early October. It is the first sub-30 daily reading since June.
The parallel with June is direct. Back then, the RSI dropped below 30 as price sat near the $1,505 cycle low with all three daily moving averages overhead. On November 10, the RSI stands at 28.84 with price at $2,006 — about 33% above the June low — and all three averages overhead once again.
Volume by 16:16 UTC stood at 241.73K ETH with nearly eight hours left in the session, in line with recent days rather than the spikes that accompanied the August breakout. Whether that is enough to end the decline remains an open question. What the chart does show is the lowest RSI reading in five months, arriving with price on a level that mattered before.
Three averages now sit overhead
The 50-day SMA at $2,458 has rolled over and sits just under $2,497 — a consolidation floor through late August and September that flipped into resistance in mid-October. The 100-day SMA at $2,375 is still rising, so the falling 50-day keeps closing in on it. Between those two averages and the current price sit the 0.382 retracement near $2,307 and the long upper wick that ended the early-November rebound. The nearest ceiling is the 200-day.
What each side needs
Both scenarios start from the same two numbers: $2,006 underneath and the 200-day above.
The case for lower hinges on the bounce
While daily closes stay below the 200-day, the trend is down and rallies function as retests of lost levels. The clearest test of that view is not at $2,006, where an RSI of 28.84 leaves sellers stretched, but on the next move up. A rebound to the broken trendline near $2,090, or to the 200-day itself, that ends in a daily rejection wick would confirm former support as resistance.
A daily close under the 0.618 near $2,001 would mean the August base has failed. The next shelf below is the 0.786 retracement near $1,783, the floor of the July and August range, about 12.5% under Tuesday's price.
The case for a floor starts at $2,006
The counter-trend case rests on major support meeting an oversold daily RSI. A close that holds above the $2,006 low would be the first step. The relief target is the 200-day at $2,154, about 5.7% higher, where the 0.5 level sits alongside it.
A bounce alone does not change the trend. For the breakdown to count as a failed move, ETH would need consecutive daily closes back above the 200-day. Only then would the 0.382 near $2,307, about 13% above the current price, come back into play.
The timing was CPI; the depth is Ethereum's
The hour of the drop came from the inflation report. The size did not. At 13:45 UTC, when Coindoo's bitcoin report went out, BTC was down 1.94% and still above its 200-day average at $73,191. At 16:16 UTC, ETH was down 4.61% and had lost its own 200-day two sessions earlier. The gap between the two is Ethereum's weaker market structure, not the macro print.
Bitcoin still sets the outer limit. If it loses $73,191, ETH could be carried through $2,001 whatever its RSI reads, while a market-wide bounce could lift ETH back to the 200-day without ETH reclaiming it on a close. The next checkpoint is tonight's daily close: a finish above $2,001 keeps the August base intact for another session; a finish below it does not.
This article is for informational purposes only and is not financial or investment advice. The levels and scenarios described are based on technical analysis of public chart data and do not guarantee future price movements. Cryptocurrencies are volatile, so do your own research before making any trading or investment decision.

