Ethereum Price Falls Below $2,000 for the First Time in Three Months Amid Continued ETF Outflows
Key Takeaways
- •Ethereum dropped below $2,000 on Nov. 12, 2026, reaching its weakest level in three months after giving back much of its August rally, when it rose 32.6% to $2,467 from roughly $1,860.
- •U.S. spot Ethereum ETFs recorded $144.8 million in net outflows on Nov. 11, marking a fifth consecutive session of withdrawals, with BlackRock's ETHA accounting for $129.8 million of the total.
- •Cumulative ETF outflows over the five most recent trading sessions totaled approximately $523.8 million, extending October's $1.61 billion in net withdrawals and reversing August's inflow trend.
- •On-chain analytics firm Lookonchain reported that wallet 0x69A8 sold 6,532 ETH worth about $13.62 million, realizing an estimated $3.1 million loss on the position.
- •Technical analysis now identifies $1,965 as the key support level on the weekly chart, with a further decline targeting $1,713, while any recovery would require reclaiming $2,150 before challenging resistance at $2,240.
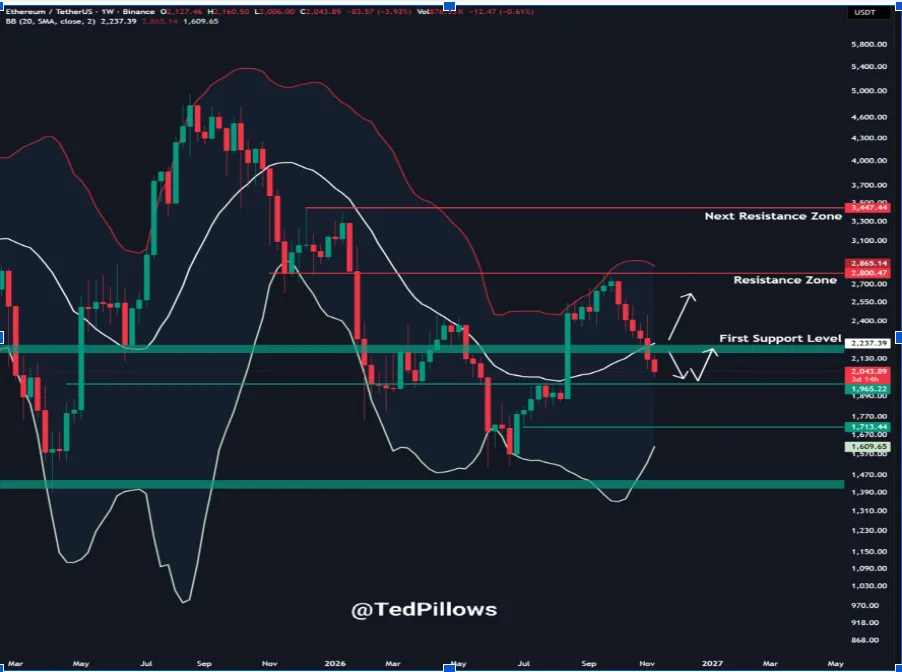
Ethereum slipped below the $2,000 mark on Nov. 12, 2026, its weakest level in three months, as renewed selling pressure unwound much of the token's August rally. The decline came as U.S. spot Ethereum exchange-traded funds extended their withdrawal streak, recording $144.8 million in net outflows on Nov. 11, according to Farside Investors. On-chain analytics firm Lookonchain also flagged a large holder selling thousands of ETH at an estimated loss.
August Rally Largely Erased
CoinGlass data show Ethereum ended July near $1,860 before gaining 32.6% to reach $2,467 by the close of August. The rally carried into September, with ETH finishing the month around $2,684, but buying momentum weakened in October, when the asset lost approximately 16% and gave back part of those gains.
The slide continued into November as Ethereum struggled to hold support above $2,200. On Nov. 10, the price dropped toward $2,005 before recovering above $2,050 during the following session. Sellers re-emerged on Thursday, however, and pushed the cryptocurrency back below the $2,000 level. Round-number thresholds such as this one are commonly watched by traders as psychological markers in technical analysis.
The move followed a recent Ethereum price analysis that identified $1,976.80 as an important downside level and warned that a break beneath it could weaken a potential recovery pattern. Ethereum's latest low approached that threshold, although the intraday decline did not result in a daily close below $2,000.
Spot Ethereum ETFs Log Fifth Consecutive Session of Outflows
The price weakness has coincided with sustained selling across U.S. spot Ethereum ETFs. Farside Investors data show the funds posted $144.8 million in net outflows on Nov. 11, marking a fifth consecutive trading session of negative flows. Spot Ethereum ETFs hold the token directly and trade on U.S. exchanges like conventional stocks, which has made their daily flow tallies a widely followed gauge of institutional demand for ether.
BlackRock's ETHA accounted for $129.8 million of the withdrawals, while its ETHB fund lost another $5.3 million. Bitwise's ETHW recorded $4.8 million in outflows, and Fidelity's FETH saw $4.1 million leave the fund.
The latest figures followed a sharp slowdown a day earlier: Ethereum ETFs registered only $1.3 million in net outflows on Nov. 10, compared with $184.6 million on Nov. 9. Even so, the cumulative loss across the five most recent trading sessions stands at approximately $523.8 million. That extends October's $1.61 billion in net outflows, reversing the inflow trend that had supported Ethereum investment products during August.
Technical Levels and On-Chain Activity Point in Different Directions
Ethereum's break below $2,000 has shifted attention toward the $1,965 support level identified on the weekly chart. If selling persists below that area, the next marked support stands near $1,713. Any recovery, meanwhile, would require ETH to reclaim $2,150 before challenging the $2,240 resistance region.
The weaker price structure has prompted some large holders to realize losses on their Ethereum positions. Lookonchain reported that wallet 0x69A8 sold 6,532 ETH worth approximately $13.62 million, estimating a $3.1 million loss on an earlier purchase of 5,105 ETH at around $2,691. On-chain firms monitor wallet activity of this kind because large-holder transactions are permanently visible on public blockchains, offering a public record of how sizable positions are being managed.
Other large traders, however, have increased their exposure despite the decline. A recent report on Ethereum whale activity noted that the whale-versus-retail positioning delta had climbed above 0.3, an indicator that measures differences in futures positioning between large and smaller traders rather than direct spot purchases.
Crypto analyst Ted Pillows also shared an updated Ethereum liquidity map on Wednesday via X, highlighting three areas of interest around $2,150, $2,250 and $2,450. Most of the liquidity shown on the chart sits above the current ETH price, making those levels worth watching if buyers return.
For now, Ethereum must first regain the $2,000 level, while another round of selling could keep the price below that mark. The next set of daily ETF flow tallies will show whether the withdrawal streak extends into a sixth session.
This article provides cryptocurrency market analysis and is not financial or investment advice. ETF flows, on-chain transactions and technical levels cannot guarantee future price movements. Cryptocurrency markets carry substantial risk.
Based on reporting originally published by The Market Periodical.

