Ethereum (ETH) Price: What the $2,600 Rebound Means for Q4
Key Takeaways
- •Ether rebounded from a September 16 low of $2,360.70 to trade near $2,600, yet remains roughly 47% below its October 2025 peak of about $4,946.
- •Exchange-held ETH has declined about 28% since May 2025 and theaked share has risen to 35.56%, shrinking the supply readily available for sale.
- •Spot ETH ETFs hold approximately $16.7 billion in assets, equal to about 5.2% of Ethereum's market value, with BlackRock's ETHA leading at more than $9 billion.
- •Professional price forecasts diverge sharply, spanning Citi's $2,240 target, Standard Chartered's $4,000, Tom Lee's $6,000 scenario tied to bitcoin reaching $150,000, and Arthur Hayes's $10,000 call.
- •ETH sits above its 50-day and 200-day moving averages with resistance between $2,655 and $2,672, while the Glamsterdam upgrade's Sepolia testnet deployment is scheduled for October 6.
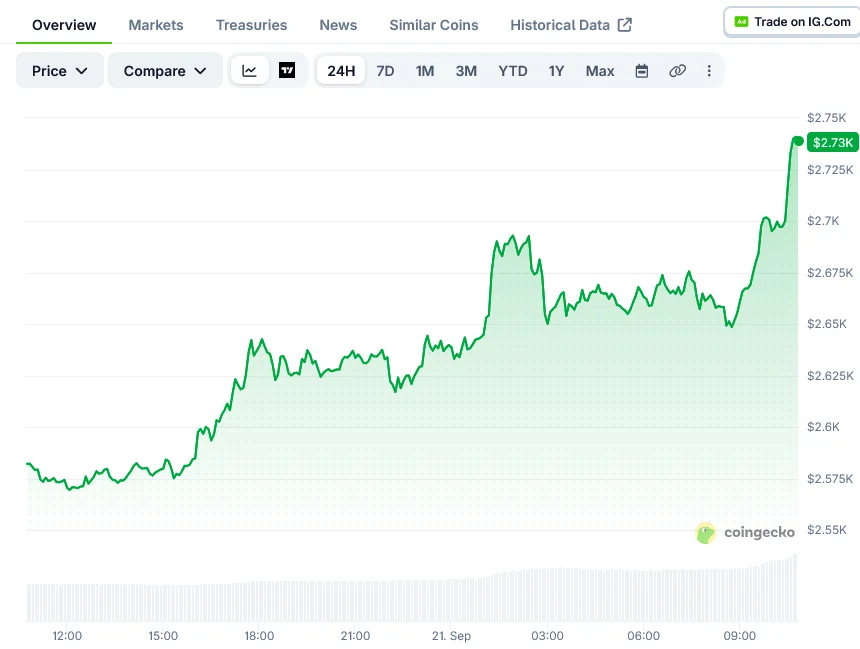
Ether (ETH), the native token of the Ethereum network, has climbed back above $2,500 after a rough stretch earlier this month. The price fell to $2,360.70 around September 16, then rallied to $2,668 before settling near $2,600. The question now is whether the recovery can hold heading into the fourth quarter. Even with the bounce, ETH remains about 47% below its October 2025 high of roughly $4,946. The rebound is real, but it has not erased the bigger picture.
Exchange Supply Keeps Shrinking
Part of the story is supply. Exchange balances have dropped about 28% since May 2025, cutting the amount of ETH readily available to sell. Coins held on trading venues are typically the most likely to change hands at short notice, so the drawdown is closely watched. Fewer coins sitting on exchanges means fewer coins that can be sold quickly, and that matters if demand keeps rising: a smaller available supply can amplify price moves in either direction.
Staking Pulls More ETH Out of Circulation
Staking has grown alongside the exchange outflows. Ethereum moved to a proof-of-stake model in 2022, allowing holders to lock up coins to help secure the network in exchange for rewards. The share of ETH staked rose from 29.8% in September 2025 to 35.56% by September 18, 2026, with the increase steady since January: the figure crossed 32% by April and kept climbing through the summer. Each staked coin is locked up rather than sitting on the open market. Taken together, the two trends mean a growing share of ETH now sits either locked in staking or away from the venues where quick selling typically happens.
The funding rate sat near 0.0046 at the time of writing. That suggests leverage has not spiked alongside the staking growth, pointing to a steadier market structure.
ETFs Add Another Layer of Demand
Spot ETH ETFs, approved by U.S. regulators in 2024, have added another layer of demand, taking in about $13.25 billion in total inflows and now holding assets near $16.7 billion. That figure equals roughly 5.2% of Ethereum's entire market value — about one out of every twenty dollars of the market's value. BlackRock's ETHA fund leads the group, holding more than $9 billion in assets.
Flows have been uneven recently. Ethereum saw more than $400 million in outflows midweek, followed by a $143.8 million inflow on September 18. The swing from heavy outflows to a solid inflow inside a single week shows how quickly this demand layer can change direction, a pattern to watch as the fourth quarter begins.
Forecasts Vary Widely for Year-End
On the price side, forecasts range widely. Fundstrat's Tom Lee has said ETH could reach $6,000 by December if bitcoin hits $150,000 and the ETH/BTC ratio recovers to 0.04. BitMEX founder Arthur Hayes has gone further, naming ETH his largest position and pointing to a possible $10,000 price by the end of 2026.
Other forecasts are more restrained. Standard Chartered's Geoff Kendrick has a $4,000 target for the end of 2026, while Citi has previously placed a 12-month target as low as $2,240. The spread — from a figure below the current price to nearly four times it — reflects how divided professional opinion remains. Lee's scenario also comes with a measurable checkpoint: the ETH/BTC ratio he references, 0.04, sits well above the roughly 0.032 recorded as of September 20.
Technical Picture
On the charts, ETH is trading above its 50-day and 200-day moving averages, at $2,272.50 and $2,076.10, respectively. Both averages are widely watched trend gauges, and the gap between them and the current price gives a sense of how much cushion the rebound has built. Resistance sits between $2,655 and $2,672. A break above that zone open the door to $2,800-$3,000, while a failure to hold could bring $2,400 back into play.
Glamsterdam Upgrade on the Calendar
Ethereum's next network upgrade, Glamsterdam, is also approaching. The Sepolia testnet version is set for October 6, with the mainnet upgrade planned for the fourth quarter. The upgrade targets higher throughput, parallel execution, and greater blob capacity. The October 6 testnet deployment offers a concrete, scheduled milestone to watch ahead of mainnet activation, which lands in the same quarter as the recovery question.
As of September 20, ETH continues to trade near $2,600, with the ETH/BTC ratio around 0.032.
This article originally appeared on Blockonomi.

