Ethereum Slides 16% From September Peak as US Spot ETH ETF Outflows Hit $1.18 Billion
Key Takeaways
- •U.S. spot Ethereum ETFs recorded approximately $1.18 billion in net outflows during October through Oct. 23.
- •The October withdrawals reversed three consecutive months of inflows, although the ETFs have attracted $12.7 billion cumulatively since approval in 2024.
- •Ethereum staking remained high at about 44.1 million ETH despite weaker fund demand, while the staking ratio edged lower to 35.91%.
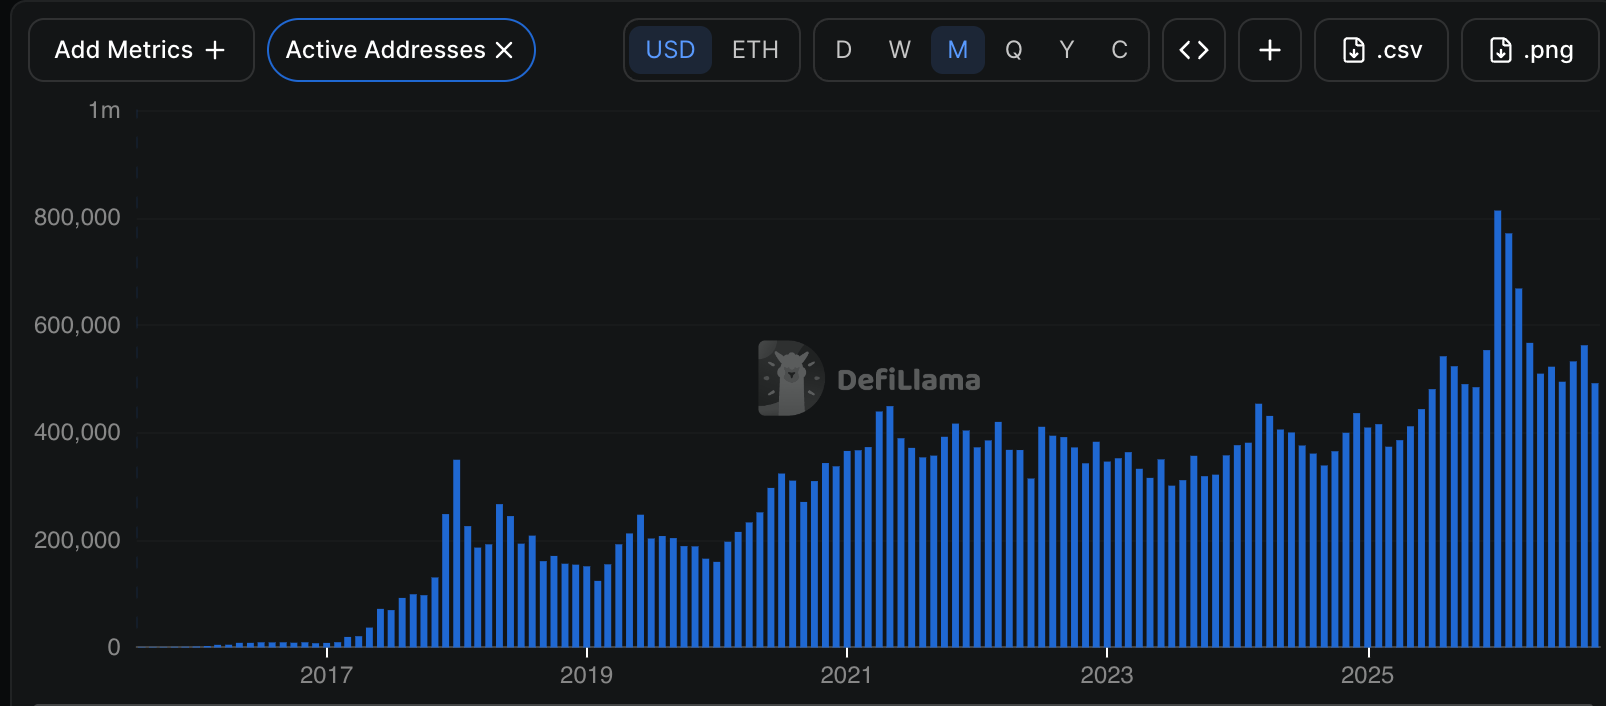
- •Ethereum network activity weakened, with TVL falling to $48.55 billion, active addresses dropping to 491,870 and stablecoin capitalization declining to above $144 billion.
- •Technical analysis identified $2,155 as a potential downside level, with a break below it potentially exposing ETH to $2,000.
Ethereum (ETH) remained under pressure on Oct. 25 as withdrawals from U.S. spot Ethereum exchange-traded funds (ETFs) continued to weigh on market sentiment. The token traded near $2,350, down roughly 16% from its September peak of about $2,804. Data compiled by SoSoValue shows U.S. spot Ethereum ETFs recorded approximately $1.18 billion in net outflows in October through Oct. 23. Daily flow tallies for these funds have become one of the most closely followed measures U.S. investor demand since the products began trading last year.
Staking activity, however, presented a different picture. Ethereum staking remained elevated, with 44.1 million ETH staked despite weaker ETF demand, and substantial amounts of the token still awaiting entry into the validator network. Staking involves locking ETH to support network security and operations in exchange for rewards, and the queue of tokens awaiting validator activation is tracked on-chain, giving a running view of how much supply is already committed.
The decline has unfolded against a backdrop of rising U.S. bond yields, a slowing labor market, and cooling on-chain and stablecoin activity across the Ethereum ecosystem.
Spot Ethereum ETF Outflows Have Soared
U.S. investors have continued pulling money out of ETH ETFs throughout the month. According to SoSoValue, the funds shed more than $1.1 billion in assets in October, their worst month since November last year, when they lost over $1.42 billion. With SoSoValue's October figures compiled through Oct. 23, the remaining sessions of the month will determine whether this month's tally closes above or below that November mark.
This month's outflows mark a sharp reversal after three consecutive months of inflows. The funds added over $832 million in assets last month, following $1.85 billion in August, and accumulated $3 billion across the previous three-month stretch. That followed a strong stretch for the products, which had attracted steady demand in prior months.
Since their approval in 2024, the ETFs have taken in $12.7 billion in net inflows and now hold more than $14.5 billion in total assets. BlackRock's ETHA, Fidelity's FETH, and Grayscale's ETHE command the largest market share. Because these funds hold spot ETH, net outflows reflect redemptions outpacing new subscriptions, tying the daily flow data directly to the underlying token.
Ethereum products have also recorded deeper outflows than ETFs tied to other cryptocurrencies this month. Spot Bitcoin ETFs shed $174 million in October after adding more than $6 billion across the previous three months. Spot XRP ETFs, by contrast, added $14 million this month, extending a winning streak that dates back to March, when the funds shed $31 million.
The ETF weakness has coincided with a modest dip in staking. Total staked ETH fell to 43.86 million from this month's high of 43.87 million, nudging the staking ratio down from 36% to 35.91%, even as the reward ratio rose to 2.7%. The staking ratio tracks the share of ETH supply committed to validation, while the reward ratio reflects the annualized yield stakers earn.
Ethereum Pressured by Macro and Network Headwinds
Rising U.S. bond yields are among the macro risks weighing on ETH. The 10-year Treasury yield has climbed in recent months and recently jumped to 5.3%, its highest level in years, as America's public debt surged past $40.3 trillion. Signs of an economic slowdown have added to the pressure, with the U.S. adding just 29,000 jobs last month. Crude oil prices have continued rising as well, with Brent climbing to $117 and West Texas Intermediate (WTI) to $103.
Ethereum's network metrics have softened alongside the macro pressure. The network's total value locked (TVL) — the value of assets deposited across its decentralized finance protocols — dropped to $48.55 billion from this month's high of $53 billion. The number of active addresses fell to 491,870 this month from 562,500 last month, while the stablecoin market capitalization slipped to over $144 billion from its record high of $163 billion. Stablecoins, tokens pegged to fiat currencies such as the U.S. dollar, are the primary medium for trading and settlement across crypto markets, which is why their combined capitalization is a widely cited gauge of capital sitting inside the ecosystem.
ETH Price Technical Analysis
On the daily chart, Ethereum has slumped over the past few weeks, moving from its September high of $2,804 to around $2,360. A closer look shows the token has formed a head-and-shoulders pattern and is now sitting on the neckline — a formation that typically precedes further downside. ETH has also dropped below the 38.2% Fibonacci retracement level and fallen under both the 50-day and 100-day moving averages. Fibonacci retracement levels, drawn by applying standard ratios to a prior price swing, are among the most commonly used markers for locating potential support and resistance zones.
Based on this setup, the analysis points to a possible decline toward the 50% retracement level at $2,155, about 8.60% below the current price. A drop below that level would point to further downside toward the 61.8% retracement level at $2,000.
This article is for informational purposes only and does not constitute financial advice. Cryptocurrency investments carry substantial volatility and potential capital losses. Readers should conduct independent research before making investment decisions.

