Ethereum Holds Near $1,900 as Spot ETF Inflows Extend Four-Day Streak, Network Metrics Strengthen
Key Takeaways
- •U.S. spot Ethereum ETFs recorded $72.64 million in net inflows on July 22, extending their inflow streak to four trading sessions.
- •Ethereum futures open interest reached $27.7 billion, its highest level since June 4 and up from this month’s low of $21 billion.
- •Ethereum’s DeFi total value locked rose to $41 billion from a monthly low of $37 billion, with gains across Lido, Aave and Binance Staked ETH.
- •Ethereum processed more than 203 million transactions in the second quarter and has handled 55 million transactions so far in the current quarter.
- •Stablecoin supply on Ethereum fell to $151 billion from a year-to-date high of $168 billion, while decentralized exchange volume continued to decline.
Ethereum traded near $1,900 after moving within a narrow range over several sessions. The consolidation coincided with four consecutive days of U.S. spot Ethereum ETF inflows, rising futures open interest, and DeFi TVL near $42 billion. These indicators reflected heightened market activity but did not independently confirm a price breakout.
Spot Ethereum ETFs Extend Inflow Streak
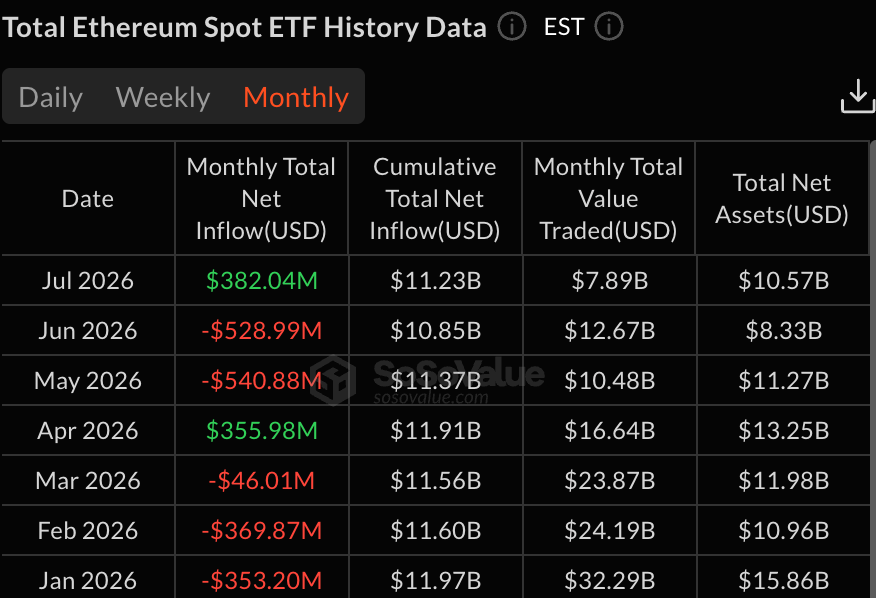
According to SoSoValue, U.S. spot Ethereum ETFs recorded $72.64 million in net inflows on July 22, extending their positive-flow streak to four consecutive trading sessions. The cumulative inflows over that period reached more than $184 million, and the funds have added over $382 million in assets so far in July — a sharp reversal from the over $528 million in outflows in June and $540 million in outflows in May.
BlackRock's ETHA led the latest daily inflows at $53.4 million, while Fidelity's FETH ETF added close to $20 million. Ethereum ETFs have now accumulated over $11.2 billion in total assets, with current assets under management (AUM) standing at $10 billion. ETF flow data is closely watched because spot funds provide a regulated wrapper for Ethereum exposure, but daily creations and redemptions can fluctuate and do not necessarily translate into sustained spot-market demand.
Futures open interest has also climbed, reaching $27.7 billion — its highest level since June 4 — up from this month's low of $21 billion. Open interest measures the total value of outstanding derivatives positions that have not been closed or settled. Rising open interest signals greater futures participation but does not by itself reveal whether positioning is bullish or bearish. Positive funding rates indicate that perpetual-futures long positions are paying shorts, reflecting a leveraged long bias rather than confirmed spot demand.
Network Metrics Show Mixed Trends
Third-party data indicates that Ethereum's network activity has been gaining traction. Total value locked (TVL) in the network has risen to $41 billion, up from a monthly low of $37 billion. Among the top protocols, Lido's assets have increased by 15%, while Aave and Binance Staked ETH have grown by 13% and 11.6%, respectively. TVL is commonly used as a gauge of capital deposited in decentralized finance protocols, though it can be affected by asset prices as well as new deposits or withdrawals.
Ethereum processed over 203 million transactions in the second quarter — a record high — and has handled 55 million transactions so far in the current quarter.
However, some metrics have pulled back in recent days. Stablecoin supply on the chain has declined to $151 billion from a year-to-date high of $168 billion, and DEX volume has continued trending downward. These measures are relevant because stablecoins and decentralized exchanges are core parts of Ethereum-based trading and settlement activity, so declines can point to softer on-chain liquidity even when transaction counts remain elevated.
Technical Analysis Overview
Ethereum's price has rebounded over the past several weeks following a double-bottom pattern at $1,509, with a neckline at $1,840 — its highest level on June 15. The token has crossed above its 25-day Exponential Moving Average (EMA). Additionally, the Coppock Curve indicator has risen to 14.95, up from a low of minus 37 in June. On the technical side, analysts have identified $2,000 as the next notable resistance level, with a potential further target at $2,500 should the token break above that threshold. Traders tracking the setup are likely to monitor whether ETF inflows, derivatives positioning, and on-chain liquidity continue to align or diverge in the coming sessions.
This article is for informational purposes only and does not constitute financial or investment advice. ETF flows, futures open interest, DeFi TVL, transaction data, and technical indicators do not guarantee future Ethereum price performance. Cryptocurrency markets remain highly volatile, and readers should conduct their own research before making investment decisions.