Ethereum Breaks Above $2,600 to Reach Its Highest Level Since
Key Takeaways
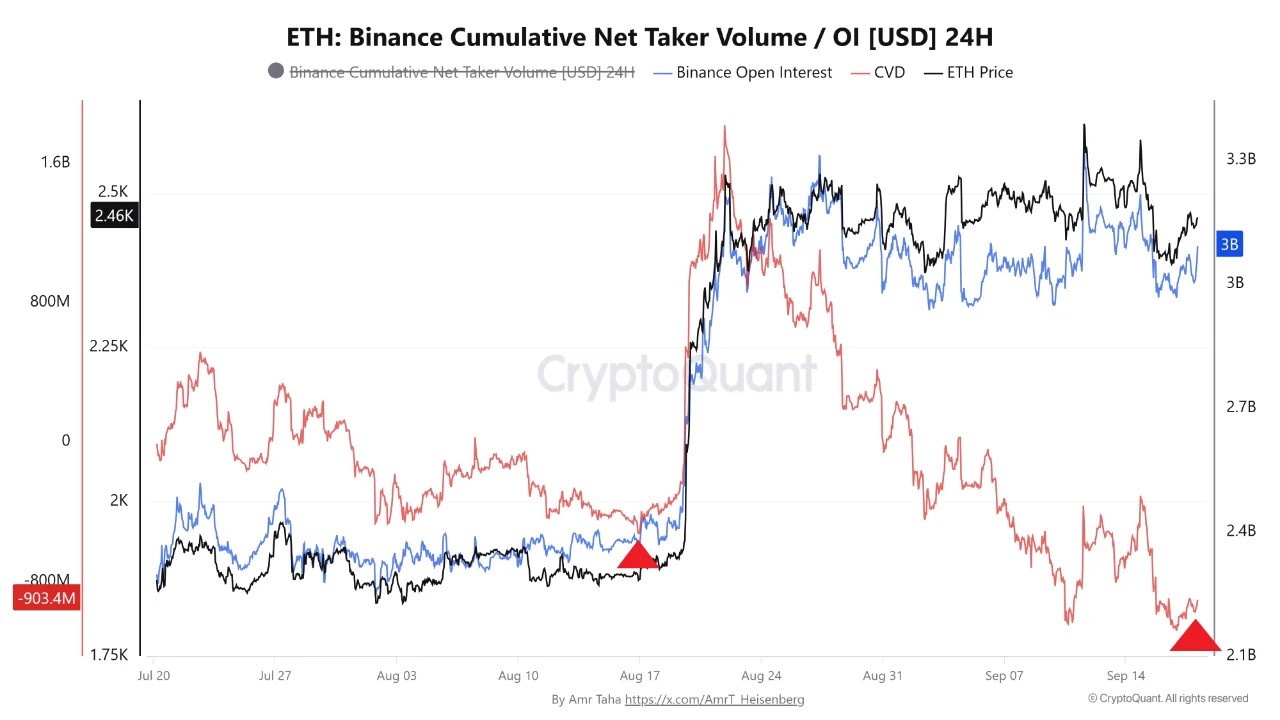
- •Cumulative net taker volume on Binance reached approximately negative $903 million ahead of the breakout, indicating aggressive market sellers outweighed aggressive buyers on that exchange.
- •Ethereum's price held firm despite the selling imbalance and subsequently broke above $2,630, its highest level since January.
- •Open interest stood near $3 billion, below a recent high of roughly $3.3 billion, lending only limited support to the idea that a leverage expansion alone drove the rally.
- •Santiment recorded an increase in Ethereum transactions above $100,000 and a record 207 million non-empty addresses during the move, though neither metric proves that whales accumulated ETH.
- •Approximately 43 million ETH, or about 35% of circulating supply, is committed to staking, which reduces the amount available for immediate trading at any given moment.
Ethereum (ETH), the second-largest cryptocurrency by market value, advanced during a broad, altcoin-led market rally, but its order flow tells an unusual story. Market sellers had dominated trading on Binance in the run-up to the breakout, yet their aggression failed to push the price into a sustained decline.
Heavy Seller Presence on Binance Before the Breakout
A CryptoQuant chart shared by analyst Amr Taha on X placed cumulative net taker volume near negative $903 million. At the point where the chart ended, Ethereum was trading closer to $2,460, ahead of its subsequent move above $2,630.
Net taker volume measures aggressive market buying against aggressive market selling. A negative reading indicates that sell orders demanding immediate execution outweighed comparable buy orders on the tracked Binance market. Importantly, the figure does not mean $903 million left Ethereum, since every completed sale still required a buyer on the other side.
Binance ranks among the largest cryptocurrency exchanges by spot trading volume, which is why its order-flow data is often used as a reference point for broader market behavior—although any single venue still captures only part of total ETH trading.
Open interest stood close to $3 billion, below a recent high of roughly $3.3 billion. The metric counts outstanding derivatives positions without distinguishing longs from shorts, and its failure to print a new high lends only limited support to the idea that a sudden expansion in leverage alone drove ETH higher.
Price Held Firm Against the Selling Imbalance
Despite increasingly negative taker flow, Ethereum did not decline at the same pace. The price remained relatively stable near the end of the CryptoQuant chart and subsequently pushed through $2,630.
That divergence is consistent with passive buyers resting limit orders and letting sellers trade into them. Demand may also have arrived through other exchanges, institutional desks, or on-chain venues. Because the chart covers Binance only, and not the entire ETH market, it cannot identify which buyers supplied the opposing demand.
Taken together, the sequence points to a plausible explanation rather than a confirmed cause: aggressive sellers were repeatedly matched without ever gaining control of price. Once that supply thinned out, ETH needed comparatively less additional demand to move higher.
Large Transfers Increased as the Price Broke Higher
Santiment reported an increase in Ethereum transactions worth more than $100,000 as ETH reached its January high. The uptick shows that large holders became more active during the move, although the metric does not reveal whether they were buying, selling, or transferring funds between their own wallets.
Whale-tracking metrics of this kind are widely monitored because large holders can move substantial sums in single transactions, even when the data offers no view into their intent.
Santiment also counted a record 207 million non-empty Ethereum addresses. That reflects an expanding on-chain footprint, but addresses should not be treated as individual users: one owner can control multiple wallets, while inactive addresses and accounts holding very small balances remain in the total.
Neither measurement proves that whales accumulated ETH. What they show is that the breakout occurred alongside greater activity from large addresses and a wider distribution of balances across the network.
Staking May Have Tightened the Liquid Supply
More than 40 million ETH is currently committed to staking, according to data cited by Santiment. The Ethereum staking dashboard places the amount at approximately 43 million ETH, or about 35% of the circulating supply.
Under Ethereum's proof-of-stake design, validators commit ETH to help secure the network and process transactions, earning rewards in return. Staking cannot explain why Ethereum rose on a particular day, and staked coins are not permanently removed from circulation—validators can withdraw after completing the network's exit process. The large staked balance nevertheless reduces the amount of ETH available for immediate trading at any given moment.
If sellers become less aggressive while a substantial share of supply remains committed to staking, even a moderate increase in demand can have a larger price effect. That possibility fits the Binance data, but it still requires confirmation through subsequent price action.
The Breakout Must Survive Its First Pullback
Ethereum's move above $2,630 clears a level not reached since January, but an intraday advance alone does not establish support. A daily close above the area would complete the breakout session, and remaining above the level in later trading—or returning to it and attracting buyers—would provide stronger evidence that the market has accepted a higher range.
A quick reversal below $2,630 would change the interpretation. It would suggest that aggressive Binance sellers were temporarily contained rather than fully absorbed, and that demand weakened once reached its multi-month high.
The first meaningful bout of profit-taking should therefore reveal more than the initial surge. Open interest, currently near $3 billion, adds another reference point: renewed expansion from that base would indicate fresh leverage entering the market. If ETH holds the breakout while taker flow remains negative or begins to recover, buyers will have shown that they can absorb supply at higher prices. If it falls back into its former range, the increase in whale transactions and wallet activity will look more like movement around the rally than evidence of durable demand.
This article is provided for informational purposes only and does not constitute financial or investment advice. Cryptocurrency prices, derivatives data and on-chain metrics can change rapidly.

