Ethereum’s $2,800 Breakout Could Put $4,850 in Focus
Key Takeaways
- •Ethereum faces a critical resistance zone between $2,750 and $2,800, and a weekly close above $2,800 would open a technical path toward $3,963 and the $4,850 record-high area.
- •Four previous Ethereum breakouts from comparable structures generated gains of approximately 65.8%, 93.4%, 91.0%, and 134.7%, forming the basis for the current fractal comparison.
- •A sustained decline below $2,150, the lower boundary of the broader range, would weaken the bullish setup and shift focus toward deeper support levels near $2,175 and $1,965.
- •BitMine increased its Ethereum treasury by purchasing 17,362 ETH, lifting total holdings above 6 million ETH—about 4.9% of total supply—with more than 5 million ETH staked.
- •Ethereum recorded its strongest weekly close in eight months and has traded above its 50-week moving average for a second consecutive week.
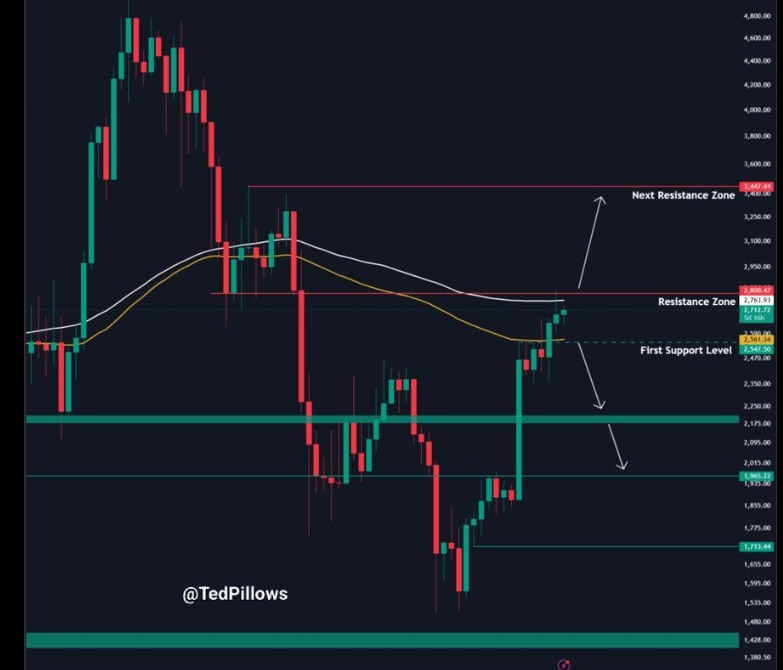
Ethereum is testing the $2,800 resistance zone after trading within a broad range. A confirmed breakout could place $3,963 among the first technical targets and bring the $4,850 record-high region into focus. However, a sustained decline below $2,150 would weaken the current bullish setup and expose lower support levels.
Ether has climbed back above $2,650 as traders monitor resistance around $2,700 and the broader barrier between $2,750 and $2,800. A weekly close above $2,800 could open a path toward $3,963 and, later, the $4,850 area. Historical Ethereum setups produced gains of approximately 65% to 135% after similar breakouts. From the referenced price near $2,723, a move to $4,850 would represent roughly 78%, or close to 80%, upside.
Ethereum’s Setup Hinges on a $2,800 Breakout
ETH has recovered strongly from lower levels but now faces a resistance zone that previously acted as barrier during earlier phases of the market structure. The setup requires buyers to push Ethereum through this range and hold the breakout. Zones like this matter to chart watchers because they mark price areas where selling previously absorbed buying attempts, and sustained trading through them is treated as a shift in the structure’s balance.
A weekly close above $2,800 would provide a clearer route toward the next technical levels. Weekly closes are a common reference point in technical analysis because they filter out intra-week volatility, offering a cleaner read on whether a level has actually been reclaimed. The nearest target is around $3,344, based on the 0.618 Fibonacci level in the longer-term setup. Another technical level appears near $3,447, while $3,963 marks a previous cycle-top area used in the broader price projection.
Ethereum would need to clear each of these resistance areas during such a move. The $3,344 Fibonacci level and the area near $3,447 could become points where selling returns to the market. A move through both levels would leave $3,963 as the next major technical area.
Historical Breakouts Keep $4,850 in Focus
Ethereum has recorded several large moves after breaking above comparable resistance structures. Four earlier breakouts produced gains of approximately 65.8%, 93.4%, 91.0%, and 134.7%. These figures form the basis for the current fractal comparison.
The historical moves provide a reference for the present structure, which again places ETH near the upper boundary of its range. A sustained move above $2,800 would therefore bring higher technical levels into focus. Fractal comparisons of this kind serve as a reference framework rather than a forecast: they assume similar structures can produce similar outcomes, but they do not adjust for shifts in broader market conditions.
The longer-term Fibonacci setup places the 100% retracement near $4,867, close to the $4,850 target used in the current projection. Fibonacci levels, derived from fixed mathematical ratios, are among the most widely followed reference points in chart analysis, which is why these specific prices tend to draw attention. From $2,723, ETH would need to rise by about 78% to reach $4,850. The $3,963 level is near previous cycle highs and would require a move of roughly 45% from the referenced price of $2,723.
A second long-term setup places the 1.618 Fibonacci level near $7,332. That level is well above $4,850 and represents a separate extension target.
$2,150 Remains Key Ethereum Support
The bullish structure would weaken if Ethereum falls below $2,150, which marks the lower boundary of the broader range. A sustained break below that level could shift attention toward lower support areas. The shorter-term setup places support near $2,547, while deeper levels appear around $2,175 and $1,965.
In related ETH news, The Market Periodical reported that BitMine expanded its Ethereum treasury by purchasing another 17,362 ETH, bringing its total holdings above 6 million ETH. The company holds about 4.9% of Ethereum’s total supply, with more than 5 million ETH staked as part of its treasury strategy. Staking commits those tokens to Ethereum’s network validation process, meaning staked holdings are subject to protocol rules rather than being immediately liquid.
The update came as Ethereum recorded its strongest weekly close in eight months. ETH was trading above its 50-week moving average for the second consecutive week. Taken together, the $2,800 barrier, the $2,150 floor, and BitMine’s growing treasury outline the checkpoints market observers are tracking as upcoming weekly closes arrive.
Original source: The Market Periodical.

