Ethereum Faces Pullback Risk Near $1,920 Resistance Even as On-Chain Analyst Targets $3,000
Key Takeaways
- •Ethereum was trading near $1,900 as of August 6, 2026, facing repeated resistance at $1,920 that has rejected multiple price attempts since mid-July.
- •Technical indicators including RSI divergence and the declining 100-day SMA suggest an increased probability of a short-term retracement toward support near $1,870.
- •The $1,870 support level represents a three-part confluence where the 0.236 Fibonacci retracement intersects with two trendline references from ETH's broader ascending channel.
- •Analyst Ali Martinez identified Ethereum's realized price near $2,300 as the next major reference level and $3,000 as a larger target based on the MVRV valuation framework.
- •Over 10 million ETH previously changed hands around the $3,000 level, which could create selling pressure if Ethereum eventually reaches that price target.
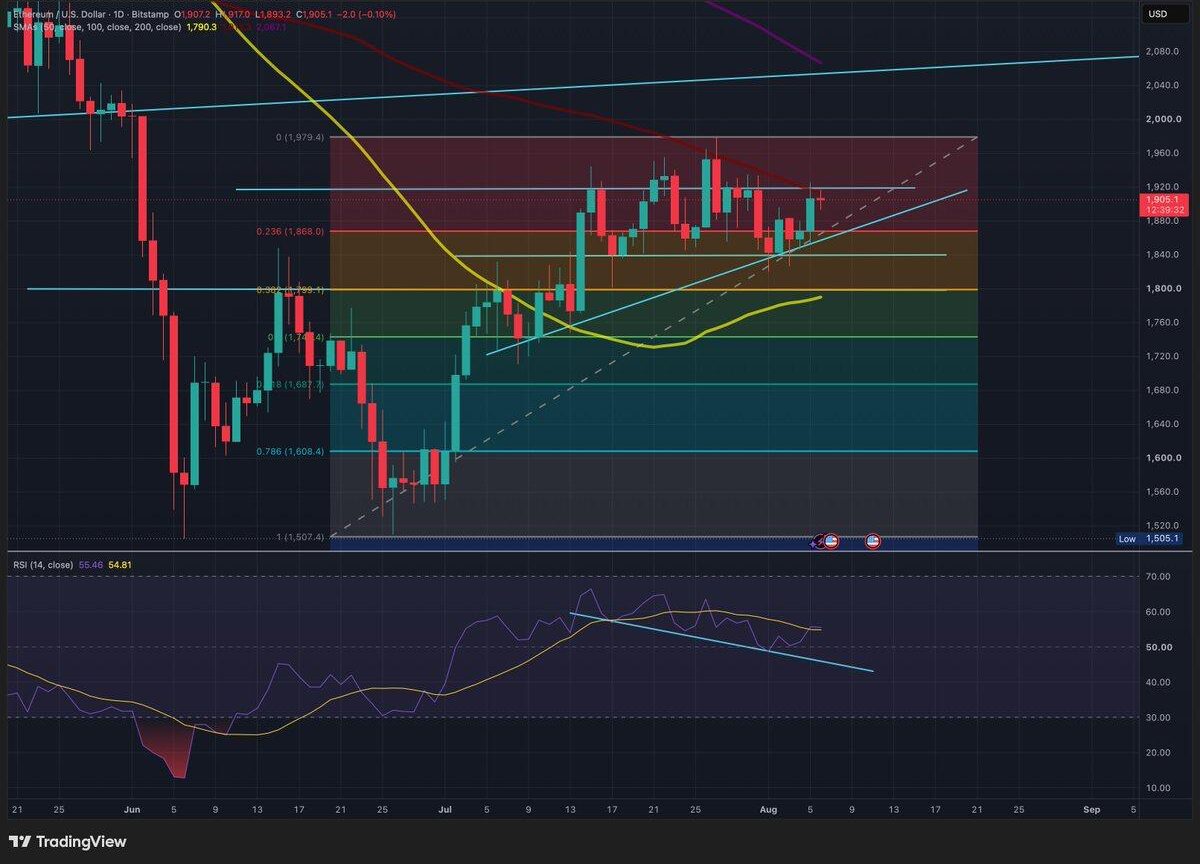
Ethereum, the largest smart contract platform and second-largest digital asset by market capitalization, is testing repeated resistance near $1,920, a level reinforced by the declining 100-day simple moving average (SMA). Because ETH's technical structure often sets the tone for the broader altcoin market, its ability or failure to clear this zone is widely tracked across crypto trading desks. While the broader recovery structure remains intact, technical indicators suggest an increased likelihood of a short-term retracement before ETH can mount another sustained move higher.
As of August 6, 2026, Ethereum was trading near $1,900 after reaching an intraday high around $1,917. Horizontal resistance near $1,920 has rejected multiple attempts since mid-July, and the declining 100-day SMA now reinforces that same area. The 200-day SMA, by contrast, remains considerably higher at approximately $2,070.
Resistance Favors a Short-Term Pullback
ETH has continued to form higher lows along the rising structure that began at its late-June bottom. That recovery pattern remains intact, but price has reached the upper boundary of its current range.
The Relative Strength Index (RSI) stood near 55.5, slightly above its moving average of approximately 54.8. While momentum remains positive, the RSI's pattern of lower highs indicates that the latest advance has not been accompanied by proportionally stronger momentum.
If the daily candle closes lower following another rejection near $1,920, it would strengthen the case for a short-term pullback toward the $1,868 confluence zone. A bearish move would only be confirmed if ETH subsequently loses the rising trendline and closes below that support. Conversely, a daily close above $1,920 would weaken the pullback thesis.
Why $1,870 Matters
The first significant support level sits near $1,870, where the 0.236 Fibonacci retracement converges with two trendline references. One is the upper boundary of the smaller descending channel that ETH previously broke above; a return to that line would test whether former resistance has become support. The same area also intersects with the lower trendline of the larger ascending channel.
This creates a three-part confluence:
- The 0.236 Fibonacci retracement
- The upper boundary of the broken descending channel
- The lower support line of the broader ascending structure
A hold in this area would preserve the higher-low structure and could create a cleaner base for another attempt higher. A decisive break below it would shift attention toward horizontal support near $1,840. Below that, the broader $1,790–$1,800 zone combines the 0.382 Fibonacci retracement with the 50-day SMA.
Martinez's On-Chain View Points Higher
Analyst Ali Martinez takes a more bullish view over a longer timeframe. In an analysis published on X, Martinez argued that Ethereum entered a stronger valuation regime after moving above its MVRV 0.8 Pricing Band near $1,800.
The MVRV (Market Value to Realized Value) framework compares Ethereum's market value with the average value at which its supply last moved on-chain. MVRV is one of the most widely followed on-chain valuation metrics in crypto analysis, used to gauge whether market price is extended above or below the network's aggregate cost basis. A ratio below 1 historically signals that market price has fallen below the average on-chain acquisition price, a condition often associated with undervaluation; a rising ratio above key thresholds, conversely, reflects strengthening demand relative to the cost basis of existing holders.
ETHEREUM IS HEADING TO $3,000
1/6 🧵👇
— Ali Charts (@alicharts) August 6, 2026
Martinez identified Ethereum's realized price near $2,300 as the next major reference level. He then highlighted $3,000 as the larger target if the recovery continues. A pullback would not necessarily invalidate that outlook—ETH could retest support, preserve its broader rising structure, and resume the advance at a later stage.
Martinez also pointed to an MVRV Momentum golden cross, highlighting four earlier signals that were followed by gains ranging from approximately 50% to 166%. The sample size is small, however, and those historical moves should not be treated as a forecast. Liquidity, macroeconomic conditions, and investor demand all differ between market cycles.
$3,000 May Also Create Resistance
Martinez's data indicates that more than 10 million ETH previously changed hands around the $3,000 level. Some holders who acquired tokens near that price may look to sell when price returns to their entry point. This historical acquisition cluster could slow the advance even if Ethereum eventually reaches the target.
Funding Shows a Long Bias, Not a Directional Signal
Ethereum's eight-hour OI-weighted funding rate has remained mostly positive since early July, according to CoinGlass data. Positive funding means that traders holding perpetual-futures long positions are generally paying those positioned short. Weighting the calculation by open interest gives more influence to markets carrying larger leveraged positions.
Perpetual futures have become the dominant leveraged instrument in cryptocurrency trading since their introduction, with funding rates serving as a widely watched gauge of directional sentiment and leverage positioning. The data shows that positioning remains tilted toward longs. Recent readings have stayed below the local peak near 0.01% recorded in late May, though that comparison alone does not indicate whether leverage is excessive. Open interest, leverage ratios, and liquidation concentrations would also be needed to assess how crowded the trade has become.
Funding therefore functions primarily as a sentiment measure in this context. Traders are leaning bullish, but the data cannot determine whether ETH will break resistance immediately or first return to support. A pullback while funding remains positive could place leveraged longs under pressure. A successful support retest, however, would bring trader positioning back into alignment with Martinez's wider bullish thesis.
Pullback and Bullish Target Can Coexist
The daily chart currently supports a cautious stance after Ethereum's return to repeated resistance. A retracement toward the nearby confluence zone would test whether the rising structure still has buyer support. Martinez's $2,300 and $3,000 targets belong to a wider timeframe, while CoinGlass funding data shows that derivatives traders remain biased toward a bullish outcome.
A successful support retest would bridge the two perspectives: short-term weakness followed by a possible continuation of the broader recovery.
Methodology: This article combines an ETH/USD daily chart captured on August 6, 2026, the technical thesis supplied with the chart, Ali Martinez's MVRV analysis, and CoinGlass OI-weighted funding-rate data. Technical levels, trendlines, moving averages, and RSI readings are taken from the supplied chart. Historical MVRV performance and the $3,000 transaction cluster are attributed to Martinez.
Disclaimer: This article is provided for informational and educational purposes only and does not constitute financial or investment advice. Technical levels, on-chain indicators, and funding rates can change rapidly and do not guarantee future price performance.

