Ethereum Tests 100-Day SMA as ETF Inflows Recover While Trading Flows Lag
Key Takeaways
- •Ethereum is trading around $1,920 as of August 8, just above the 100-day SMA near $1,906, in a pivotal daily test of whether the breakout can be sustained.
- •U.S. spot Ethereum ETFs attracted approximately $245 million in net inflows over the past week, marking an improvement from a challenging summer of repeated outflows.
- •The $1,985 Fibonacci retracement level represents the next major resistance zone, having previously rejected a rally attempt on July 27.
- •CoinGlass data shows negative spot net flows of approximately $24.36 million over 24 hours and $79.91 million over three days, indicating aggressive selling continues to outpace aggressive buying.
- •The daily RSI reads approximately 57, placing momentum above the neutral threshold without entering traditionally overbought territory.
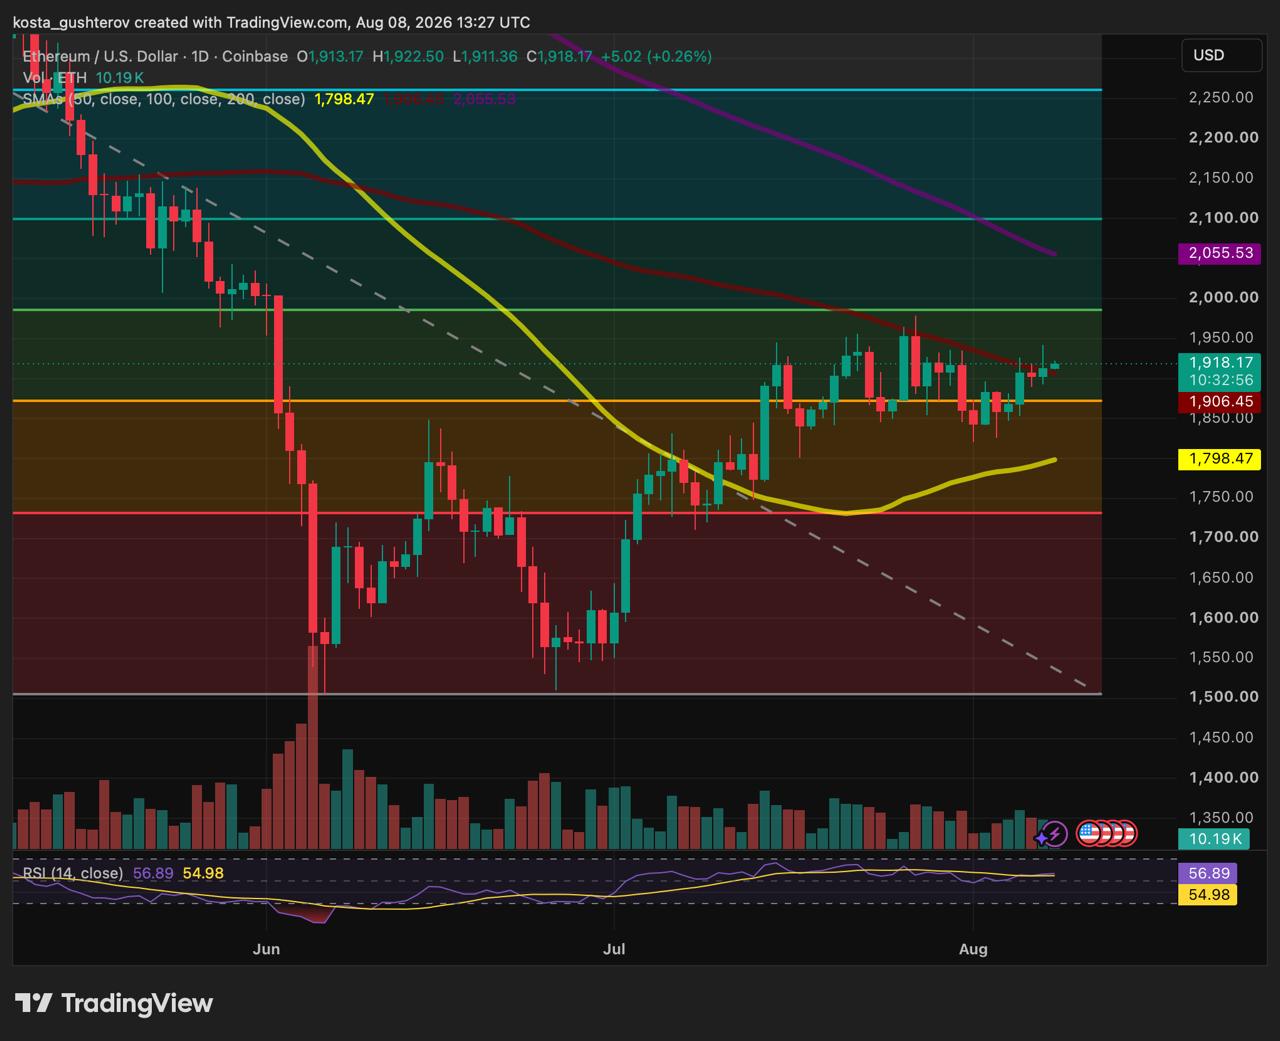
Ethereum is trading around $1,920 as of August 8, slightly above the 100-day simple moving average (SMA) near $1,906, in what has become a pivotal daily test for the cryptocurrency. U.S. spot Ethereum ETFs attracted approximately $245 million in net inflows over the past week, according to SoSoValue data, though CoinGlass metrics paint a more mixed picture of short-term spot and futures activity.
A Two-Week Resistance Under Scrutiny
The 100-day SMA has acted as repeated resistance since late July, making the current daily close a critical gauge of whether Ethereum's latest advance can be sustained.
This resistance zone formed after ETH approached the 0.5 Fibonacci retracement level near $1,985 on July 27 and was rejected. Following that rejection, price slipped back below the moving average and remained predominantly underneath it until this week's recovery effort.
Yesterday's trading session finally pushed ETH above the average, and the price has held above it through the time of writing. However, with the moving average currently situated around $1,905—close enough to the prevailing price that an intraday dip below it would not be unusual—the daily close carries greater analytical weight. It will reveal whether buyers can maintain the breakout following multiple failed attempts to reclaim the level.
Momentum indicators have improved in tandem with the move. The daily Relative Strength Index (RSI) reads approximately 57, placing it above the neutral 50 threshold without entering traditionally overbought territory.
The $1,985 Resistance Zone
Even if Ethereum holds above the 100-day SMA, a more formidable resistance zone lies ahead. The 0.5 Fibonacci retracement near $1,985 marks almost exactly where the July 27 rally stalled.
This area also overlaps with the broader price region from which Ethereum's early-June decline accelerated, eventually driving ETH toward $1,500. That June selloff was part of a wider correction across digital assets that saw Ethereum fall roughly 25% over several weeks. Consequently, buyers are approaching a chart area that has proven significant during both the recent recovery phase and the preceding selloff.
A decisive breakout above $1,985 would place the falling 200-day SMA, currently near $2,050, as the next technical reference point. Until such a move occurs, Ethereum has improved its short-term structure but has not yet cleared the larger resistance established by the prior downturn.
ETF Flows Recovering From a Weak Summer
U.S. spot Ethereum ETFs recorded approximately $245 million in net inflows over the past week, according to SoSoValue data. This pickup stands out following a notably weaker period for the funds, though a single stronger week is insufficient to confirm a durable return of institutional demand.
Ethereum ETFs entered the current rebound after a challenging summer stretch in which repeated outflows weighed on the broader flow picture. The $245 million inflow figure is therefore more significant as an improvement from recent weakness than as confirmation of a sustained new trend.
These funds began trading on July 23, 2024, following SEC approval, making them roughly two weeks old at the time of this analysis. By comparison, U.S. spot Bitcoin ETFs launched in January 2024 and have accumulated substantially larger net assets over a longer track record. The Ethereum ETFs' early flow profile—including the Grayscale Ethereum Trust's conversion-related outflows alongside new fund launches—has contributed to the uneven inflow picture observed since inception.
The inflow recovery also coincides with ETH's attempt to reclaim an important technical level. However, this correlation does not imply that ETF buying caused the move above the 100-day SMA, as Ethereum trades across global spot, derivatives, and other markets. For the current setup, the continuation of inflows would carry more weight than the magnitude of any single positive week, particularly if ETH revisits the $1,985 resistance.
Trading Flows Send a Cautious Signal
CoinGlass data offer a more guarded signal than the price chart suggests. Spot net flow stands at approximately -$24.36 million over the past 24 hours and -$79.91 million over the trailing three days, indicating that aggressive selling has outpaced aggressive buying across both time windows.
Futures data present a less definitive picture. The three-day net flow remains positive at roughly $407 million, while the most recent 24-hour reading turned negative by approximately $135 million. This combination does not indicate sustained buying pressure across both markets as ETH attempts to hold above the 100-day SMA. Spot activity continues to lean toward aggressive selling, while futures positioning has been inconsistent.
CoinGlass net flow measures aggressive taker buying against aggressive taker selling. Additionally, positive futures flow does not necessarily indicate traders opening new long positions, as short covering can also generate aggressive buying activity.
Price Leads, Flows Lag
Ethereum's technical position has improved more rapidly than the underlying flow data. ETH currently trades above the 100-day SMA, RSI has recovered above neutral, and ETF flows have strengthened after a weak stretch. However, CoinGlass data remain less convincing, with negative spot flow across both the 24-hour and three-day periods and no equally clear directional signal from futures.
This divergence does not invalidate the price move; rather, it indicates that stronger buying has yet to materialize consistently across the examined markets.
Today's daily close serves as the first confirmation point. A close above the 100-day SMA would position ETH more favorably to challenge the $1,985 resistance once again. Conversely, closing back below it would leave the two-week resistance issue unresolved and refocus attention on the nearby 0.382 Fibonacci area around $1,865–$1,870.
Disclaimer: This article is provided for informational and educational purposes only and does not constitute financial or investment advice. Cryptocurrency markets are highly volatile, and technical levels can fail without warning.

