Ethena (ENA) Rises 6% to Channel Top as Buyback Support Stays Out of Reach
Key Takeaways
- •ENA remains about 30% below its late-September peak despite Sunday’s rebound.
- •The token reclaimed its 50-day moving average near $0.204 but was testing resistance around $0.209.
- •USDe supply was approximately $4.76 billion, leaving it about $2.7 billion below the level needed to activate ENA buybacks.
- •Ethena is scheduled to unlock 275 million ENA, valued at about $57 million, on November 1.
- •The RSI rose to roughly 50.5, moving above its midpoint and signaling stronger near-term buying momentum.
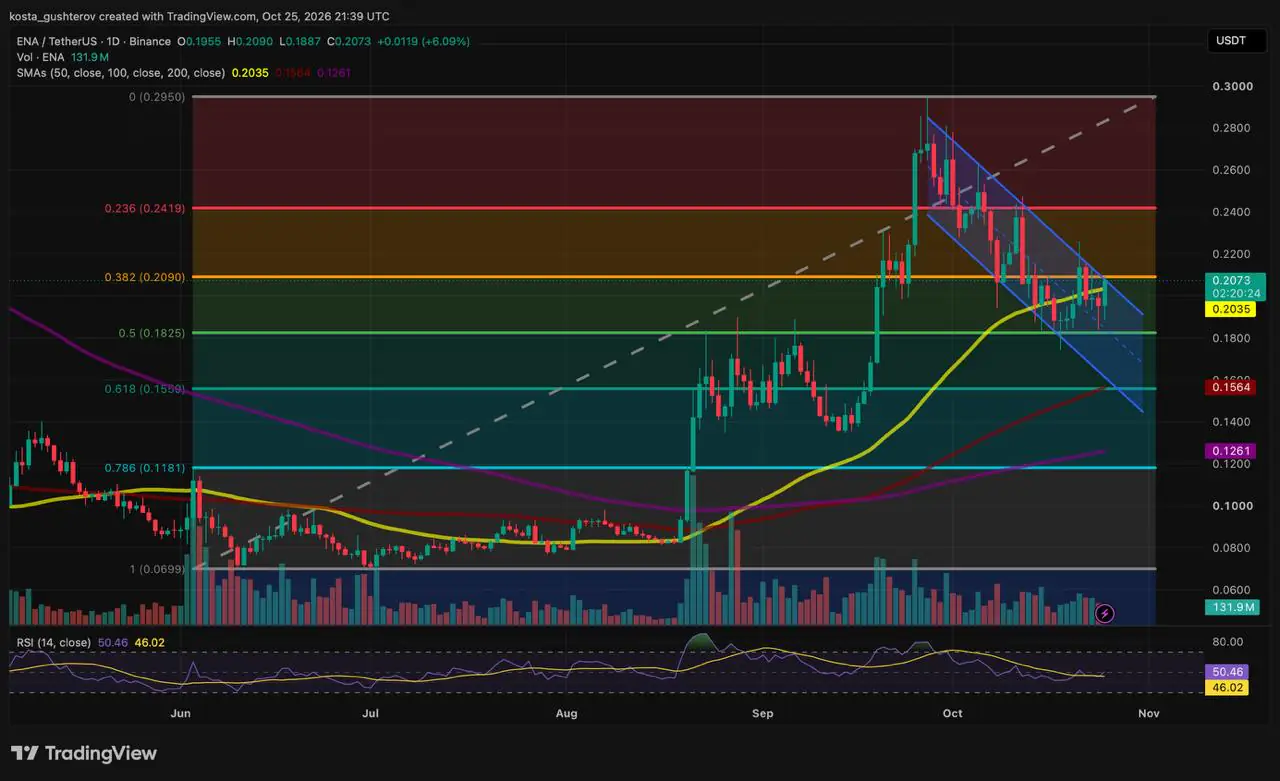
Ethena's ENA token rose about 6% on Sunday, pushing to the upper boundary of the falling channel that has framed a correction now in its fourth week, one that has left the asset roughly 30% below its late-September peak, according to Binance's ENA/USDT daily chart on TradingView. Whether anything beyond the chart is backing the bounce is a separate question — and the answer is less encouraging.
What Changed on Sunday?
ENA's summer rally carried the token from a base near $0.07 to a peak near $0.295, more than quadrupling its value. The subsequent correction stayed inside an orderly falling channel and bottomed near $0.18, at the 0.5 Fibonacci retracement of that advance. Sunday's session stretched the rebound from that low to roughly 15%.
A falling channel is drawn along a series of lower highs and lower lows between parallel trendlines, so its upper edge marks the ceiling the downtrend has imposed. Two technical thresholds gave way during the session. ENA climbed back above its 50-day simple moving average near $0.204 and pushed through the channel's upper edge at the same time, then ran into the 0.382 Fibonacci level near $0.209, less than 1% overhead. With hours left in the session, the break was still intraday, leaving the daily close to decide whether it holds.
Is Momentum on the Buyers' Side?
For now, yes. The relative strength index (RSI) has crossed back above the 50 midpoint to about 50.5, clearing its signal line near 46. The RSI is a momentum gauge that runs from 0 to 100, with readings above 50 generally signaling that buying pressure has the upper hand. Volume has reached about 131.9 million ENA so far, with the candle still open.
Why Hasn't the Buyback Story Kicked In?
Under Ethena's fee switch, approved by governance in September, 95% of qualifying net protocol revenue is directed to ENA buybacks — but only once the 14-day average supply of its USDe synthetic dollar reaches $7.5 billion. USDe stood near $4.76 billion in mid-October, according to DefiLlama data, about $2.7 billion short of that trigger.
Buyback programs of this kind are a common way for DeFi protocols to return revenue to tokenholders, routing a set share of protocol income into open-market purchases of the native token. Until the gap closes, there is no protocol-funded buyer behind ENA, which means Sunday's move most likely rests on chart buyers alone.
What Could Get in the Way?
The first obstacle is funding. USDe's yield, and with it the demand that grows its supply, comes largely from funding payments on perpetual futures — periodic transfers between traders on these no-expiry contracts that keep their prices aligned with spot markets. Those payments shrink when leveraged longs are wiped out, and about $816 million in positions were liquidated across the market on Saturday, mostly longs, according to CoinGlass.
The second is token supply. A one-time release of all remaining investor tokens on October 5 ended the investor unlock schedule, and ENA has slid since then. Another 275 million ENA, worth about $57 million at current prices, is set to unlock on November 1. Unlocks move previously locked allocations into tradable circulation, adding to the token float the market has to absorb.
Put together, that is the bear case: a single strong candle has not ended a month of lower highs, and both pressures arrive before any buyback support can.
Where Does ENA Meet Support and Resistance?
Above the 0.382 Fibonacci level, the next marker is the 0.236 Fib near $0.242, about 17% higher and the level where the October breakdown began. Clearing it would bring the late-September peak near $0.295 back into view, roughly 42% above current prices.
Below, the reclaimed 50-day SMA is the first line of defense, followed by the 0.5 Fib near $0.182, about 12% lower. A deeper slide would meet the 0.618 Fib near $0.156, where the 100-day SMA sits almost exactly on top, and then the 200-day SMA near $0.126. The base of the summer rally, near $0.07, lies about 66% below today's price.
Three Ways the Week Could Play Out
These are scenarios, not forecasts. ENA sits between the 0.382 Fib just overhead and the 50-day SMA just below.
In short:
- ENA is testing the 0.382 Fib near $0.209.
- USDe sits $2.7 billion short of the buyback trigger.
- A 275 million ENA unlock lands on November 1.
- RSI has crossed back above its 50 midpoint.
This article is provided for informational purposes only and does not constitute financial advice. Cryptocurrency prices are volatile.

