ETH/BTC Breakout Raises Altcoin Season Debate as Bitcoin Dominance Nears 60%
Key Takeaways
- •ETH/BTC broke above a descending channel that had constrained the pair since August 2025.
- •Fresh whales accumulated 50,000 ETH this month as the ETH/BTC ratio rose 6%.
- •Bitcoin dominance is near 60% and is retesting a resistance zone around 59.5% to 59.6%.
- •A break below 58% in Bitcoin dominance could strengthen the case for rotation toward altcoins.
- •Analysts remain split, with Michaël van de Poppe noting Ethereum’s breakout while Benjamin Cowen questioned whether a classic altcoin rotation will occur this cycle.
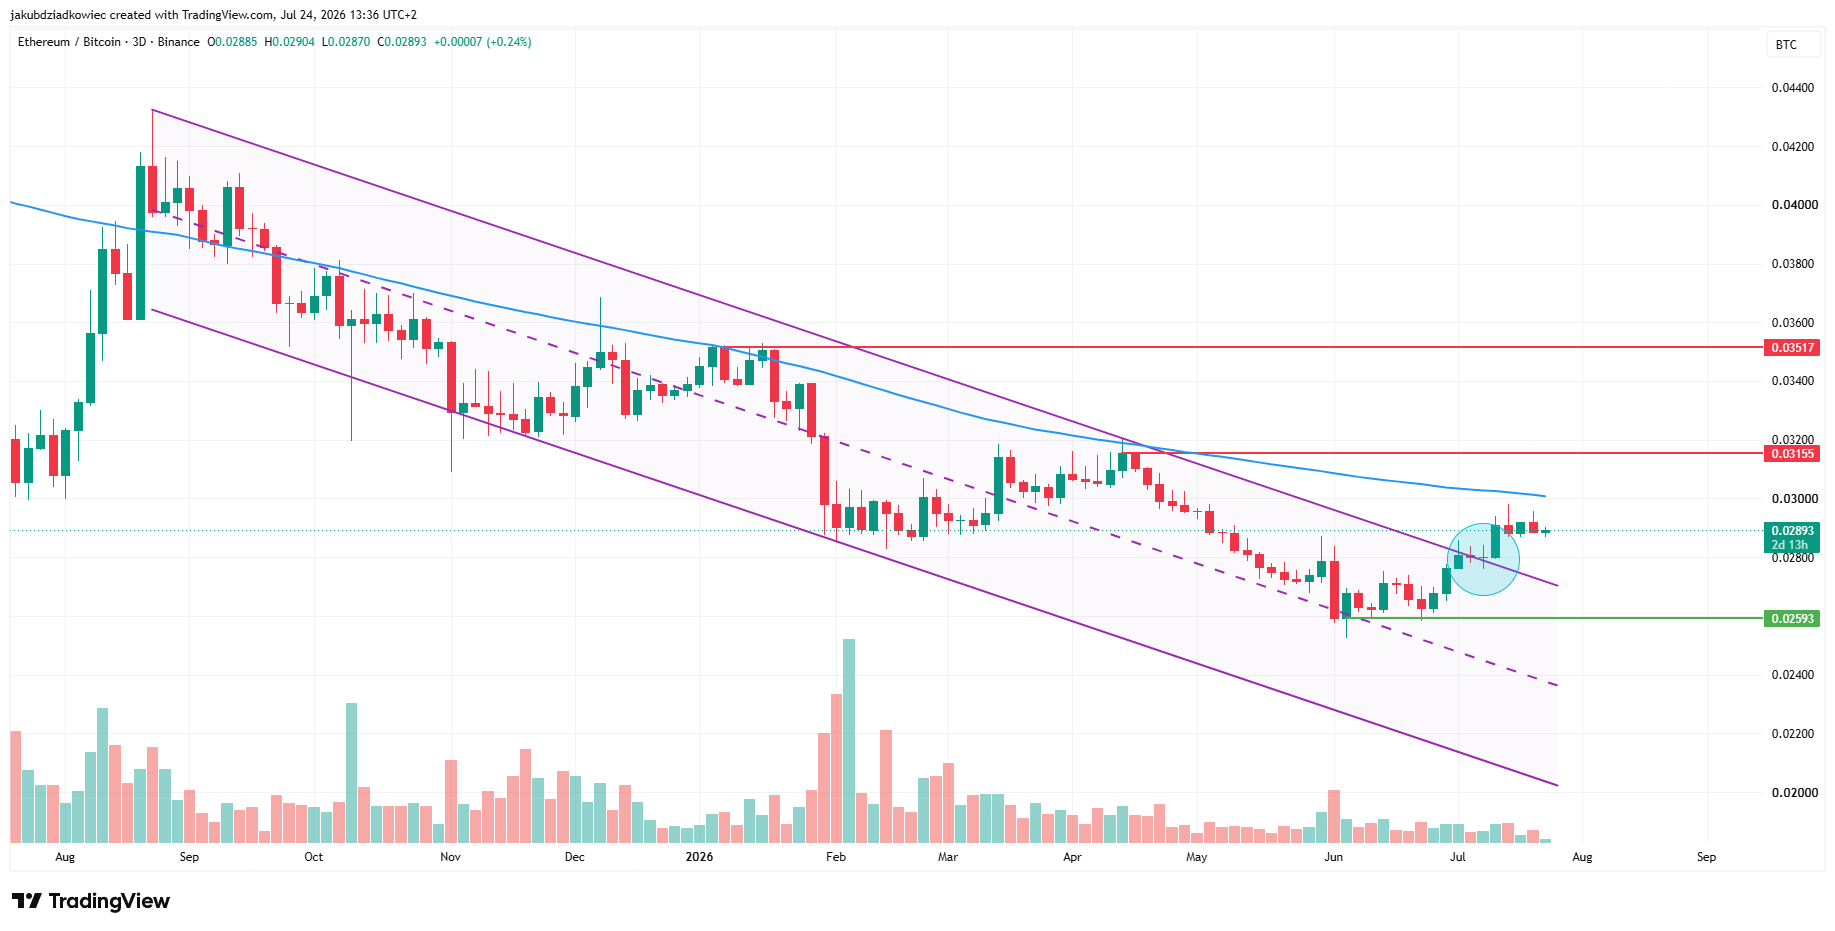
Ethereum (ETH) has recorded its first sustained move higher against Bitcoin (BTC) in nearly a year, breaking above the descending channel that had constrained the ETH/BTC pair since August 2025.
Bitcoin dominance, however, presents a more cautious picture. The metric is moving back toward 60%, and analysts remain split over whether a genuine altcoin season can begin in 2026. ETH/BTC is widely watched because it measures Ethereum’s relative performance against Bitcoin, while Bitcoin dominance tracks Bitcoin’s share of the total crypto market capitalization. Together, the two indicators are often used to assess whether capital is rotating from Bitcoin into larger altcoins.
Ethereum Breaks Above Long-Running Bitcoin Pair Downtrend
The ETH/BTC three-day chart shows that a descending parallel channel had been in place since August 2025. For almost a year, the pair repeatedly formed lower highs and lower lows within that structure.
In July, the ratio closed above the channel’s upper boundary. It is now trading near 0.0289, while Ethereum is priced at $1,881, down 2.2% over 24 hours. Fresh whales accumulated 50,000 ETH this month as the ratio rose 6%.
The breakout still faces significant overhead levels. Immediate resistance is at 0.0316, with the next barrier at 0.0352. The ratio also remains below the 200-day moving average, shown as the blue line on the chart. A reclaim of that moving average could clear a path toward the first resistance area.
If ETH/BTC retreats, the nearest support is at 0.0259. That area broadly aligns with the broken channel boundary, which could turn into confirmed support if the pair holds above it.
Momentum moved first. The three-day Relative Strength Index (RSI) broke out of a long-term falling wedge, described as a bullish pattern, at the end of June. Price followed several weeks later, a sequence that is often viewed as validating a trend reversal.
The RSI is now around 57. That places it above the neutral zone while still below overbought territory near 70.
Analyst Michaël van de Poppe described the move as the pair’s first real upward move in more than a year, while adding that he expects Bitcoin to lead in the short term.
Great move on $ETH vs. $BTC and it's the first real upwards move in over a year. #Altcoins have suffered a lot and a ton of people will likely still have PTSD from it. However, in the short-term, I think $ETH vs. $BTC might be consolidating and correcting for a bit. Why? I… pic.twitter.com/QTTrDBPiMa — Michaël van de Poppe (@CryptoMichNL) July 16, 2026
Bitcoin Dominance Holds Near 60%
The monthly Bitcoin dominance chart provides the broader context. A long-term descending trendline has capped the metric since 2017, and each touch, marked by blue circles on the chart, has preceded an altcoin season. The first occurred in 2017 near 80%, and the second came in 2021 near 73%.
A third touch took place in mid-2025, when Bitcoin dominance was rejected at 66%. The metric later slipped below the 0.236 Fibonacci retracement level at 59.63%. However, it did not reach the 0.382 level at 55.66%, nor the 0.618 level at 49.23%. A move to those levels would indicate a fuller rotation into altcoins.
The three-day chart offers a more immediate trigger. Since August 2025, Bitcoin dominance has moved sideways between 58% and 60.7%. An ascending support line within that range broke down at the end of May.
Dominance is now retesting the broken line from below near 59.5%. That retest coincides with the long-term 0.236 Fibonacci level, forming a confluence of resistance. A rejection at this zone could push the metric below the 58% floor and toward 55.66%. By contrast, a reclaim would target 61% and delay the altcoin rotation, even as the index shows early momentum.
Benjamin Cowen, founder of IntoTheCryptoverse, offered a different view in his contribution to BeInCrypto’s Market Intelligence expert council and the accompanying video analysis. He argued that the classic rotation may not occur in this cycle.
“This is a cycle where Bitcoin topped on apathy rather than euphoria.”
According to Cowen, a top driven by apathy leaves no crowd ready to rotate into riskier assets. He cited 2019 as the closest comparison and maintained October 2026 as his base case for the cycle bottom.
Conditions Cited for an Altcoin Season Signal
The ETH/BTC charts indicate that a rotation may be developing. Price and momentum broke their respective downtrends within weeks of each other, while softer inflation has supported risk appetite.
The Bitcoin dominance charts still point to a need for confirmation. For the altcoin-season setup to strengthen, dominance would need to be rejected near 59.6%, then break below 58% and move toward 55.66%. Until then, ETH/BTC holding above 0.0259 keeps the structure intact, while a Bitcoin dominance reclaim of 61% would shift the cycle back toward Bitcoin. The next confirmation points, therefore, remain the same technical levels already in focus: ETH/BTC support at 0.0259, resistance at 0.0316 and 0.0352, and Bitcoin dominance reaction around the 59.5%–59.6% area.

