Durable Goods Orders Rise as AI Data Center Investment Drives Demand for Key Equipment
Key Takeaways
- •Total durable goods orders increased 0.3% in June from May and were up 8.9% from a year earlier to $360 billion.
- •The three-month average of durable goods orders rose 1.4% in June from May and 6.9% from a year earlier.
- •Computer and electronic products orders climbed 3.1% month to month and 16.7% year over year to a record $31.1 billion.
- •Orders for electrical equipment, components, and appliances rose 0.9% in June and 6.7% from a year earlier to $18.6 billion.
- •Core capital goods increased 0.8% month to month and 12.5% year over year to $85.1 billion, while core goods prices rose 0.2% in June and 5.1% year over year.
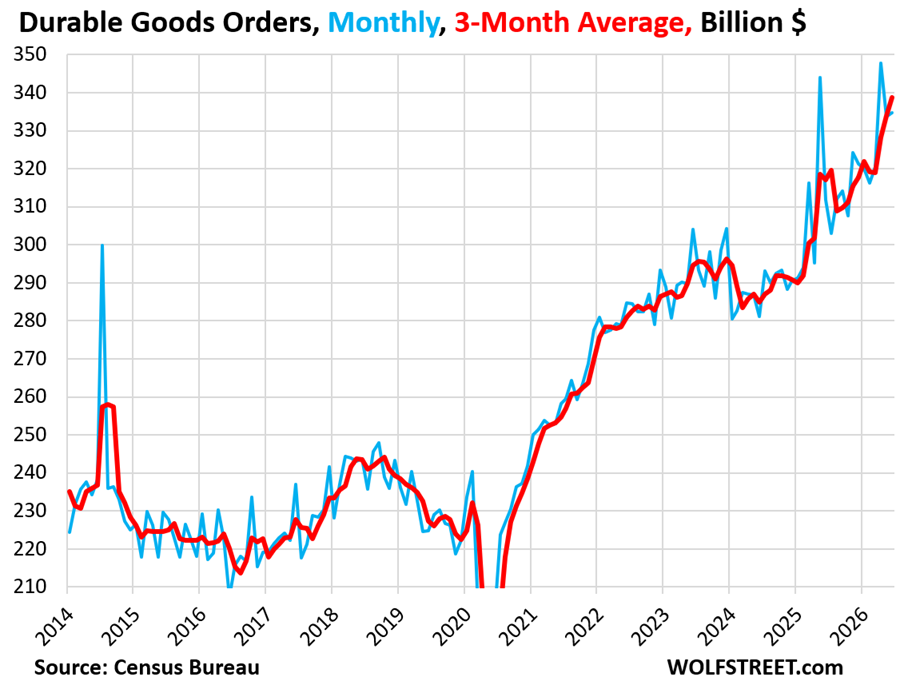
Total orders for durable goods received by manufacturers in the U.S., including aircraft and defense, rose 0.3% seasonally adjusted in June from May, according to data released by the Census Bureau. On a year-over-year basis, not seasonally adjusted total orders increased 8.9% to $360 billion.
The three-month average, seasonally adjusted, which smooths out monthly volatility, increased 1.4% in June from May and was up 6.9% from a year earlier.
Because the headline durable goods figures include aircraft and defense, they can be distorted by large, irregular orders. For example, Boeing received an order for 113 jet aircraft in June, which will be reflected in durable goods orders over the next several months. That can lift the total by billions of dollars in one period and then leave later months weaker if large orders do not repeat.
A closer look at categories tied to data center construction and operation shows where the AI investment boom is appearing. Durable goods orders do not capture every piece of that buildout, but they do provide one of the first broad manufacturing signals for demand tied to chips, power equipment, and cooling systems before those projects move from orders into production.
Orders for computer and electronic products rose 3.1% in June from May and increased 16.7% year-over-year, reaching a record $31.1 billion. This category includes semiconductor orders at U.S.-located semiconductor fabs. Industries in computer and electronic products manufacturing (NAICS 334) include:
- Computer and Peripheral Equipment Manufacturing
- Communications Equipment Manufacturing
- Audio and Video Equipment Manufacturing
- Semiconductor and Other Electronic Component Manufacturing
- Navigational, Measuring, Electromedical, and Control Instruments Manufacturing
- Manufacturing and Reproducing Magnetic and Optical Media
Orders for electrical equipment, components, and appliances, which include some of the equipment used in data centers, increased 0.9% in June from May and 6.7% year-over-year to $18.6 billion. Industries in Electrical Equipment, Appliance, and Component Manufacturing (NAICS 335) include:
- Electric Lighting Equipment Manufacturing
- Electrical Equipment Manufacturing
- Other Electrical Equipment and Component Manufacturing
- Household Appliance Manufacturing
Orders for machinery, after a sharp increase in May, were unchanged in June and rose 14.4% from a year earlier to $43.7 billion. This category includes power generation and transmission equipment used to power data centers, as well as HVAC equipment for data centers. Industries in Machinery Manufacturing (NAICS 333) include:
- Engine, Turbine, and Power Transmission Equipment Manufacturing
- Ventilation, Heating, Air-Conditioning, and Commercial Refrigeration Equipment Manufacturing
- Agriculture, Construction, and Mining Machinery Manufacturing
- Industrial Machinery Manufacturing
- Commercial and Service Industry Machinery Manufacturing
- Metalworking Machinery Manufacturing
- Other General Purpose Machinery Manufacturing
Orders for fabricated metal products declined in June from May to $45.2 billion, but were still up 10.6% year-over-year. Industries in the Fabricated Metal Product Manufacturing category (NAICS 332) use processes such as forging, stamping, bending, forming, machining, welding, and assembling metals into intermediate or end products, excluding machinery, computers and electronics, and metal furniture.
Core capital goods, defined as nondefense capital goods excluding aircraft, rose 0.8% month-to-month and 12.5% year-over-year to $85.1 billion. This category includes some, but not all, of the products listed above, along with other items such as heavy trucks, railroad rolling stock, and ships.
Orders are an early indicator of future economic activity. It can take months before orders move out of the backlog and become actual production, sales, and investment.
The surge in demand from the data center investment boom, especially for electronic products and machinery, also helped push up prices of affected goods. The Producer Price Index for core goods, a relevant inflation measure here, rose 0.2% in June from May after spikes in the prior two months, and was up 5.1% year-over-year, according to the author’s analysis of PPI data.

