Dow Jones Stages Bullish Catch-Up Over Nasdaq 100 as AI Rotation Accelerates
Key Takeaways
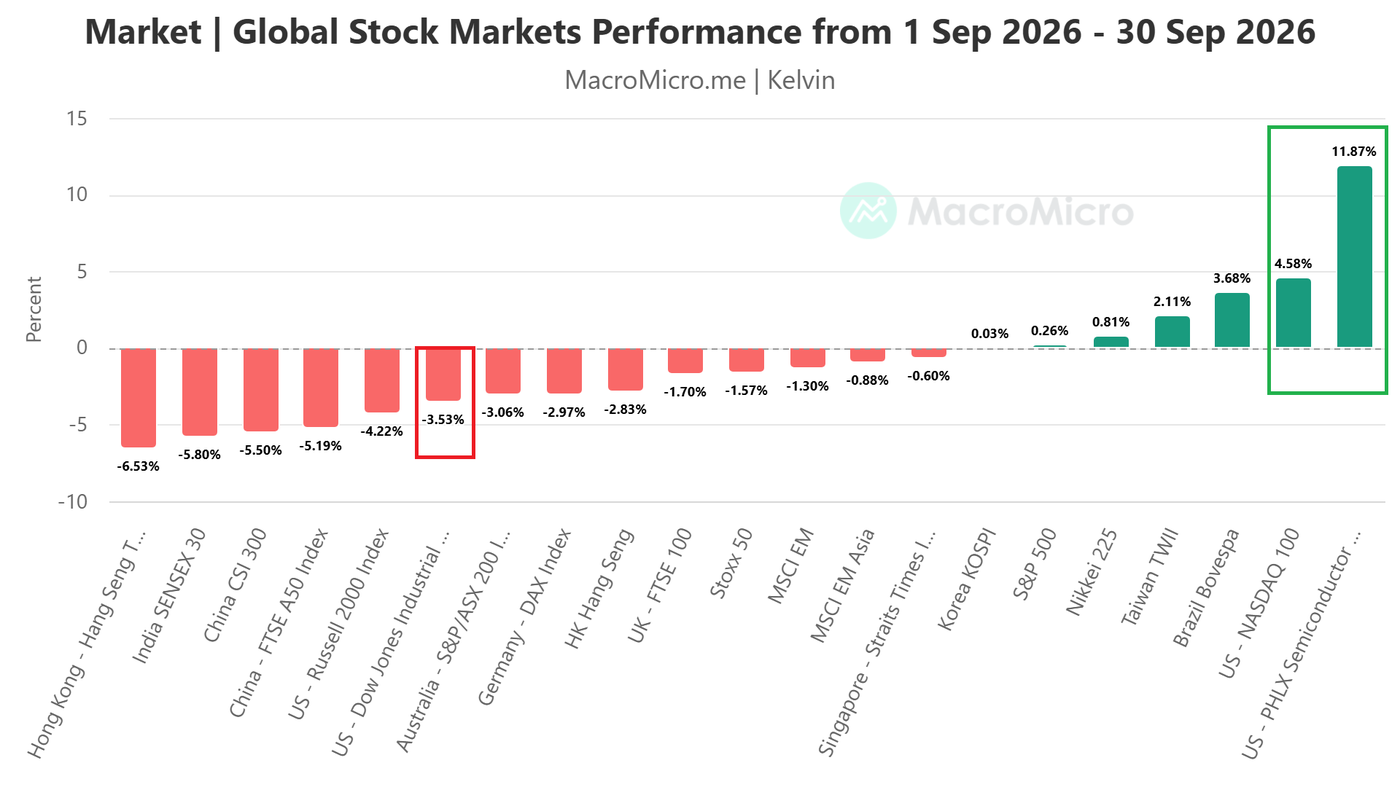
- •The Dow fell 3.53% in September 2026 but gained 2.46% in October through 15 October, outperforming the Nasdaq 100 by 4.32 percentage points amid weakness in AI-linked technology stocks.
- •A rotation away from debt-sensitive AI infrastructure names into defensive healthcare and consumer sectors has driven the Dow's outperformance, with the Philadelphia Semiconductor Index shedding 9.73% in October.
- •UnitedHealth's third-quarter earnings beat and raised outlook, along with signs of moderating government healthcare program costs, provided a fundamental earnings catalyst for the Dow's healthcare weighting.
- •Hotter-than-expected September core CPI of 2.7% year-on-year and 0.3% month-on-month pushed expectations of a Federal Reserve rate hike in October to roughly 30% from about 20%, per CME FedWatch data.
- •Technically, the US Wall Street 30 has staged a bullish breakout from a medium-term descending channel, with sustained trading above 51,950 seen as key to targeting resistances at 52,390, 52,687, and 53,100.
The Dow Jones Industrial Average (DJIA) has swung from laggard to outperformer among major US benchmark stock indices over the past six weeks, according to an analysis published by OANDA's MarketPulse. The turnaround has been driven by a rotation out of AI-linked technology names and into healthcare and consumer stocks, and near-term technical momentum now points to a potential bullish extension.
From Laggard to Leader in Six Weeks
In September 2026, the DJIA recorded a monthly loss of 3.53%, underperforming both the S&P 500 (+0.26%) and the high-flying Nasdaq 100 (+4.58%), a rally powered by AI semiconductor stocks — the PHLX Semiconductor Index surged 11.87% that month.
October has told a different story. From the start of the month through Thursday, 15 October 2026, the DJIA reversed higher and registered a gain of 2.46%, outperforming the tech-centric Nasdaq 100 (-1.86%) by 4.32 percentage points. The reversal was triggered heavily by weakness in the PHLX Semiconductor Index, which shed 9.73% amid fears of elevated AI optimism.
The Dow's October recovery gained further traction this week, with a clearer rotation toward healthcare and consumer stocks as the AI trade came under pressure. Through Thursday, 15 October 2026, after the close of the US session, the Dow had gained 1.0% for the week to 52,183, while the S&P 500 and the Nasdaq 100 declined 0.9% and 3.1%, respectively.
The divergence is partly structural: the Dow is a price-weighted index of 30 large-cap US companies with comparatively light technology weighting, while the Nasdaq 100 tracks the largest non-financial companies listed on the Nasdaq exchange — a compositional gap that leaves the two benchmarks exposed to different corners of the market whenever sector leadership shifts.
Rotation Away From the AI Trade
The drivers of the Dow's recovery have shifted since early October. The primary force behind its current outperformance is a rotation away from debt-sensitive AI infrastructure stocks toward businesses with more established earnings.
Concerns over AI financing costs intensified over the period, and cautious 2027 commentary from TSMC, the world's largest contract chipmaker, tempered enthusiasm despite the chipmaker posting another record quarterly profit. The Philadelphia Semiconductor Index fell for a seventh consecutive session on Thursday, 15 October 2026.
Healthcare and consumer stocks, traditionally viewed as defensive sectors, attracted the buying, helping the Dow outperform its technology-heavy peers — a pattern suggesting its relative strength increasingly reflects a change in market leadership.
UnitedHealth has provided company-specific support. The insurer — one of the Dow's 30 components — saw its third-quarter earnings beat expectations, management raised its outlook, and comments pointed to tentative moderation in government healthcare program costs. That gave the Dow's healthcare exposure a fundamental earnings catalyst alongside the broader rotation.
Sticky Inflation Clouds the Macro Picture
The macro backdrop also remains difficult. September core CPI, which strips out volatile food and energy prices, continued its climb to 2.7% year-on-year, while core CPI rose 0.3% month-on-month; both readings came in above forecasts of 2.5% and 0.2%, respectively. Following Wednesday's release, expectations of a Fed rate hike in October rose to around 30%, from approximately 20%, according to the CME FedWatch tool, which derives its probabilities from pricing in fed funds futures.
The Dow's resilience despite this repricing strengthens the rotation argument, but persistent inflation remains a threat to valuations and consumer demand.
The near-term view on the Dow's relative performance is more constructive. Sustained leadership from healthcare and consumer stocks, followed by improving participation from financials and industrials, would strengthen the bullish catch-up case. If leadership remains concentrated while inflation and financing costs rise, the Dow could continue outperforming the Nasdaq 100.
Bullish Breakout From a Key Descending Channel
Turning to the near-term technicals on the US Wall Street 30 CFD, a proxy for Dow Jones Industrial Average futures, price action as of Friday's Asia session on 16 October has staged a significant bullish breakout from a medium-term (multi-month) descending channel, with resistance running from the current all-time intraday high set on 5 August 2026.
Ahead of the breakout, price action pushed above the 20-day moving average — a widely watched short-term trend gauge — on Friday, 9 October 2026, and then retested and reversed bullishly off the 20-day moving average on Thursday, 15 October.
Taken together, these observations suggest the prior medium-term corrective decline — a 7.65% drop from the 5 August 2026 all-time intraday high to the 1 October 2026 low — is likely to have ended, with the US Wall Street 30 now undergoing a potential fresh bullish impulsive up move.
The key short-term pivotal support to watch is 51,950; holding above it would maintain bullish momentum. A break above near-term resistance at 52,390, which also sits near the 50-day moving average, would target the next intermediate resistances at 52,687 and 53,100.
Conversely, a failure to hold and an hourly close below 51,950 would negate the bullish tone, suggesting a potential minor corrective decline to retest the 20-day moving average, which converges with the next intermediate support at 51,550.
The opinions expressed are the author's and not necessarily those of OANDA Business Information & Services, Inc. or any of its affiliates, subsidiaries, officers or directors. The publication is for informational and educational purposes only.
Source: OANDA MarketPulse

