Dogecoin Shows Bullish Reversal Signals as Whales Accumulate 400M Tokens Near Support
Key Takeaways
- •Dogecoin rose approximately 7.4% on September 3, moving from about $0.0817 to $0.0878, and held near $0.088 the following day.
- •Whales accumulated more than 400 million DOGE over five days, lifting large-holder holdings from roughly 18.2 billion to about 18.7 billion tokens, per Santiment data.
- •Glassnode's URPD chart shows nearly 35 billion DOGE previously changed hands around $0.0813, marking it as a key on-chain support level.
- •Dogecoin's daily chart produced two technical reversal signals after the decline: a TD Sequential buy signal and a morning doji star formation.
- •U.S. spot Dogecoin ETFs recorded roughly $763,000 in net outflows on September 2, even as the token's price recovered.
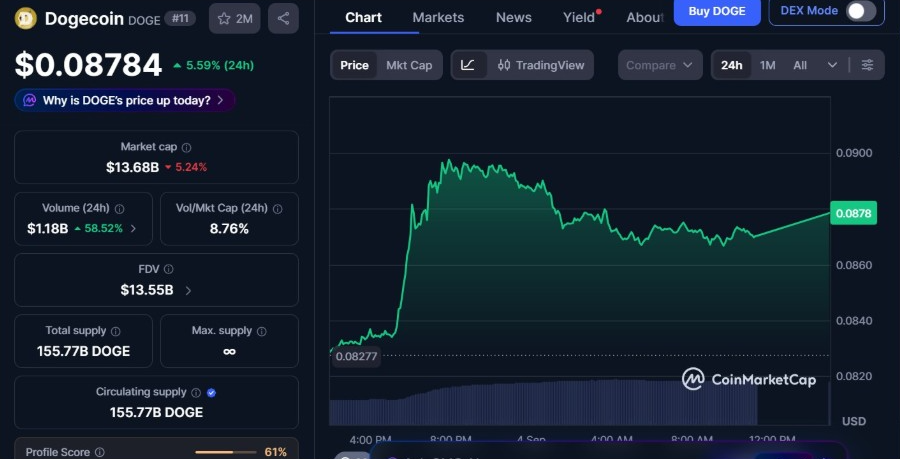
Dogecoin (DOGE) is trading near $0.088 after a sharp rebound from the low-$0.08 region earlier this week. The token climbed roughly 7.4% on September 3, moving from about $0.0817 to $0.0878, and held near that level on September 4 after touching an intraday area around $0.0884.
The recovery follows a correction from Dogecoin's August 22 high near $0.1003. Whale accumulation, a major on-chain cost-basis zone, and two technical reversal signals have reinforced the short-term recovery thesis.
Dogecoin, launched in 2013 as a joke currency based on the Shiba Inu "Doge" meme, has since grown into one of the most widely traded cryptocurrencies and a frequent proxy for retail sentiment in crypto markets, which is why shifts in large-holder activity often draw outsized attention.
Dogecoin Recovers From Recent Sell-Off
Dogecoin reached $0.1007 on August 22 before sellers took control of the market. The decline erased more than 17% from that peak and pushed DOGE toward the low-$0.08 range. Buyers began returning once the token approached support near $0.081.
Trading activity has picked up during the rebound. CoinMarketCap data shows 24-hour volume near $1.28 billion, an increase of more than 80%. Dogecoin's market capitalization stands near $13.68 billion, with a circulating supply of roughly 155.77 billion tokens. Unlike Bitcoin, Dogecoin has no hard supply cap, and its circulating supply grows continuously each year.
The bounce follows several bearish daily sessions in late August, during which DOGE slipped below $0.09 and continued falling until buying pressure emerged near its recent lows. The rebound has returned the token to the $0.088 area.
DOGE still trades below the August 22 peak, meaning the market has not fully recovered the losses from that correction. The recent move instead marks the first clear rebound after the token tested its lower support range.
Whales Buy More Than 400 Million DOGE
Large Dogecoin holders increased their positions during the pullback. Crypto analyst Ali Martinez reported that whales accumulated more than 400 million DOGE over five days while the token traded close to its recent support area.
Santiment data shared by Martinez shows whale holdings climbing from roughly 18.2 billion DOGE to about 18.7 billion DOGE. Most of that increase occurred between August 31 and September 3, when Dogecoin traded near its recent lows.
The timing of the purchases gives traders an additional data point around the $0.081 to $0.083 region. Rather than reducing exposure during the decline, these large wallets added hundreds of millions of tokens. Wallet-level accumulation of this kind is tracked by on-chain analytics firms such as Santiment and Glassnode, which aggregate holdings of the largest addresses; whale buying does not guarantee continued price strength, but it is one of the metrics market participants watch for shifts in positioning. DOGE price action still needs to hold above support and attract sufficient demand to extend the recovery.
Daily Chart Prints Two Reversal Signals
Dogecoin's daily chart has produced a TD Sequential buy signal following the recent decline. Traders commonly use the indicator to identify periods when an existing trend may be approaching exhaustion. In this case, the signal appeared after DOGE fell from above $0.10 toward $0.081.
The chart also shows a morning doji star near the same area. This three-candle formation can appear near the end of a downward move and reflects a shift from strong selling pressure to a session in which buyers begin to regain control.
DOGE has moved higher since those signals appeared. The next nearby chart levels sit around $0.088, $0.091, and $0.094. A move through those areas would bring the token closer to the range it traded in before the late-August correction.
The reversal pattern still depends on follow-through from buyers. A renewed decline toward the recent lows would return attention to the support zone that formed during the latest sell-off.
$0.0813 Becomes the Main DOGE Support
On-chain data identifies $0.0813 as a key Dogecoin support level. Glassnode's URPD chart shows that almost 35 billion DOGE previously changed hands around that price, meaning many existing holders acquired their tokens near the same area.
Martinez points to $0.1552 and $0.1774 as higher levels to watch if DOGE holds the $0.0813 floor and extends its recovery. The URPD chart also shows another notable concentration around $0.0887, close to the token's current trading range.
DOGE's recovery is unfolding while U.S. spot Dogecoin ETFs face weaker flows. The funds recorded roughly $763,000 in net outflows on September 2. U.S. spot Dogecoin ETFs began trading in 2025 following regulatory approval, giving traditional-market investors direct DOGE exposure for the first time, and their daily flows have since become a closely watched demand signal alongside on-chain metrics.
This article is for informational purposes only and does not constitute financial advice. Cryptocurrency markets can experience sharp price movements.
