Dogecoin (DOGE) Tests $0.10 Resistance as Top Traders Stay Long
Key Takeaways
- •Dogecoin rose 3.54% on Monday to $0.10, where strong resistance, immediate resistance, and the upper Bollinger Band all converge into a single ceiling.
- •Every major moving average, from the 7- to the 200-period in both simple and exponential form, is clustered at $0.09, forming the first line of technical support.
- •Futures positioning leans bullish, with a taker buy/sell ratio of 1.41, top traders 76.6% long, and retail traders 71% long, although open interest dropped 7.28% in 24 hours.
- •The analysis assigns a 55% probability to a daily close above $0.10 opening a path toward $0.12, versus a 45% bear case that could push the price back to $0.09 and down toward $0.08.
- •Bitcoin is identified as the main driver of Dogecoin's price direction over the next 30 days.
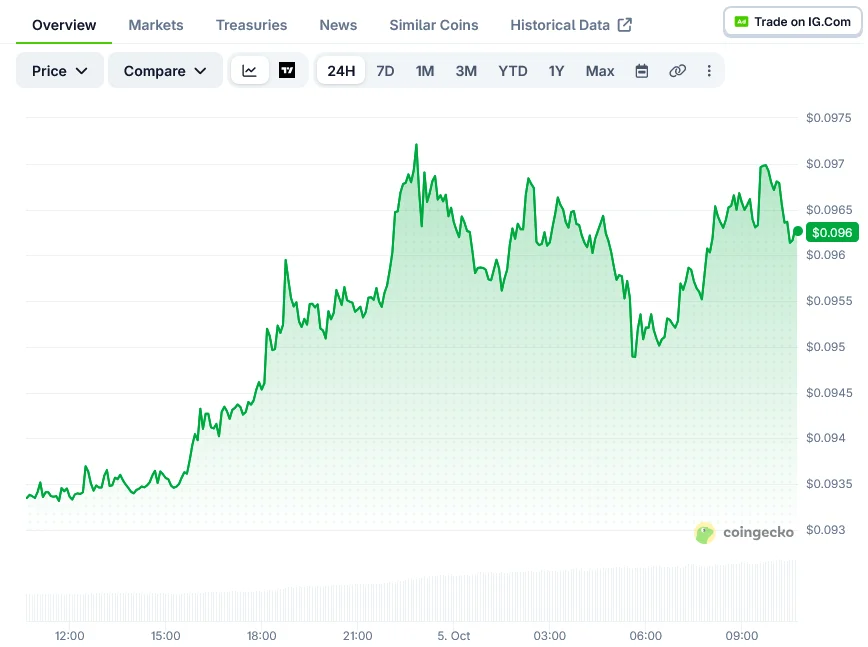
Dogecoin (DOGE) rose 3.54% on Monday, pushing the token up to $0.10 — a level that has quickly become the key price traders are watching. The move places DOGE directly at a cluster of resistance markers, while technical support is concentrated just below at $0.09.
A Ceiling Confirmed by Three Indicators
The $0.10 mark coincides with strong resistance, immediate resistance, and the upper Bollinger Band, meaning three independent measures currently point to the same ceiling. Not long ago, DOGE was trading near the opposite end of its range, close to the lower Bollinger Band around $0.08.
Below the price, every major moving average is clustered at $0.09, including the 7-, 20-, 50-, and 200-period simple moving averages as well as their exponential counterparts. Trading above entire stack of averages points to a bullish trend structure, even as the token presses against overhead resistance. With a round-number ceiling overhead and the full moving-average stack just below, DOGE is effectively boxed into a tightly defined range — which is why these two levels frame the analyst scenarios laid out further down.
Momentum Indicators Send Mixed Signals
The Relative Strength Index (RSI) stands at 59 — a neutral-to-firm reading that leaves room to climb before the indicator reaches overbought territory in the 70s. The Bollinger %B reading of 0.66 places the price in the upper half of its band, indicating DOGE is pressing against resistance rather than pulling away from it.
The MACD histogram, by contrast, sits at exactly zero. The MACD line and its signal line have fully converged, which can signal that buyers have paused at resistance. The St oscillator shows %K at 39 and %D at 31. According to Blockchain.news analyst Luisa Crawford, that combination suggests the recent advance was driven by spot buying rather than a momentum chase.
Volatility remains contained: the Average True Range (ATR) is $0.01, pointing to modest daily price swings. Either a break above $0.10 or a pullback to $0.09 could therefore unfold within a single session.
Derivatives Positioning Leans Bullish
Futures markets currently skew toward buyers. The taker buy/sell ratio stands at 1.41 — a reading above 1 that reflects aggressive buy orders outweighing aggressive sell orders — and in the last measured hour, buy volume reached 86 million against 61 million in sell volume. Top traders hold a 76.6% long allocation, equivalent to a long/short ratio of 3.28, while retail traders are also heavily long at 71%.
Open interest, however, fell 7.28% over the past 24 hours, meaning some positions were closed or liquidated even as the price held near $0.10. The funding rate sits at a neutral 0.01%, indicating traders are not yet paying a premium to hold long positions.
Analyst Scenarios: $0.12 on a Breakout, $0.09 as First Support
Crawford's analysis assigns a 55% probability to the bullish outcome. Under that scenario, a daily close above $0.10 could open a path toward $0.12, with a stretch target of $0.13 to $0.14.
The bear case carries a 45% probability. If DOGE fails to close above $0.10 within the next two to three sessions and the MACD turns negative, the price could fall back to the $0.09 support. A break below that level could send the token toward $0.08 — the lower Bollinger Band — a decline of roughly 20%. A daily close above $0.105 would invalidate the bear case.
The same analysis identifies Bitcoin as the main driver for DOGE over the next 30 days, noting that Dogecoin's price direction remains closely tied to BTC. With both scenarios keyed to DOGE's daily closes at $0.10, the MACD's direction, and Bitcoin's trend, those are the readings to watch in the sessions ahead.
Latest Reading
At last check, DOGE was trading at $0.10, down 0.12% in the latest one-minute reading, according to CoinGecko.
The full analysis is available via Blockonomi.

