Dogecoin Trades Near $0.075 as Analyst Calls Monthly Chart a “Discount Zone”
Key Takeaways
- •Dogecoin fell roughly 25% from early-October highs near $0.10 to trade around $0.0750, breaking below an ascending trendline that had held since August.
- •Weekly network transactions declined 41% year over year, average daily active addresses fell about 42%, and new addresses dropped 55%, indicating weaker on-chain activity.
- •US Dogecoin ETFs recorded approximately $15.1 million in total net inflows as of November 2, with about $1.8 million added over the previous 30 trading sessions.
- •Analyst Trader Tardigrade said Dogecoin's monthly oscillator has returned to a 'discount zone' that previously marked a bottom before a major upward move.
- •House of Doge agreed on October 21 to support Dogecoin Labs, pairing the MyDoge wallet with DogeOS, an EVM-compatible layer designed to bring smart-contract functionality to Dogecoin.
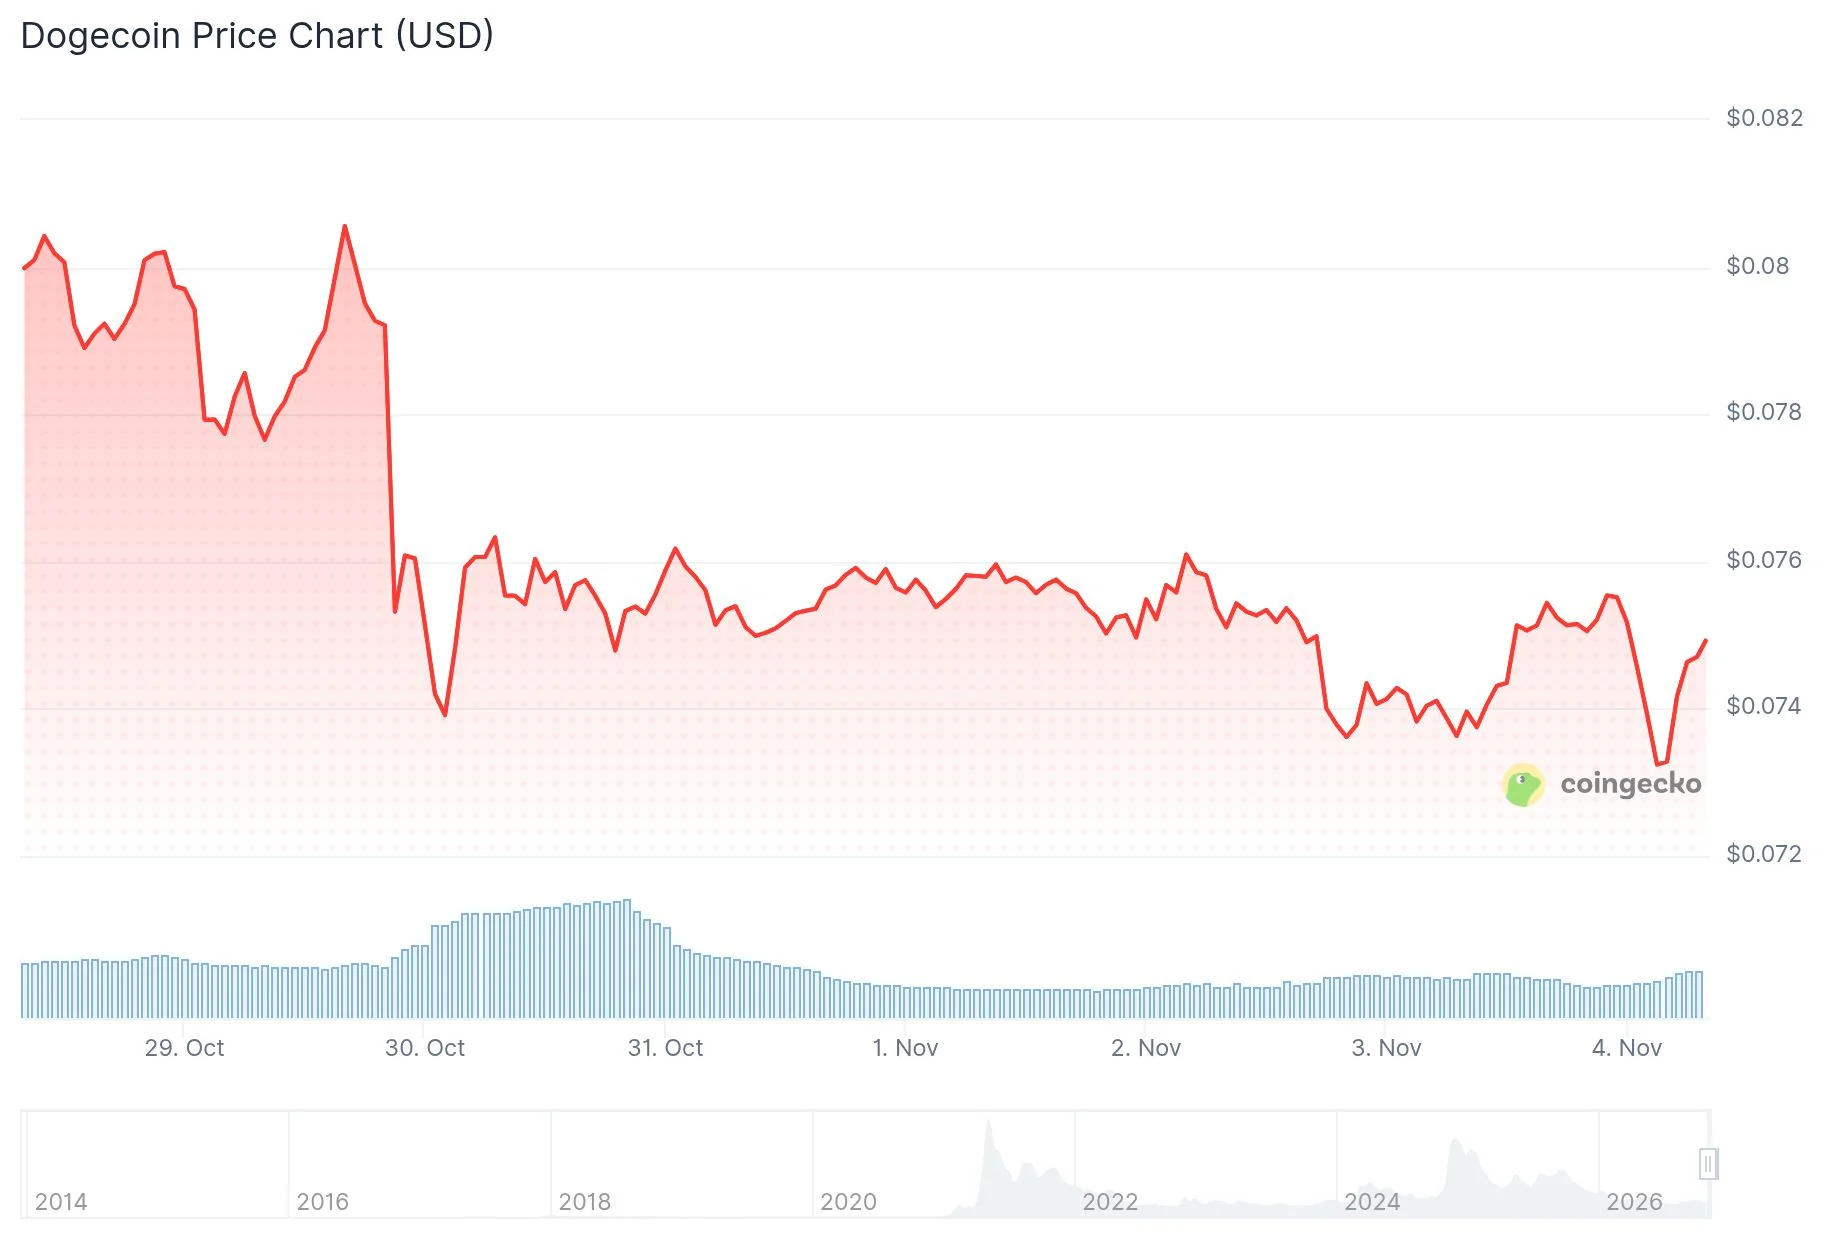
Dogecoin (DOGE) traded near $0.0750 on Wednesday, November 4, after falling about 25% from early-October highs near $0.10. The decline pushed the meme coin below an ascending trendline that had held since August and beneath $0.0792, which now acts as the first resistance level. An ascending trendline is drawn beneath successive higher lows, and chart analysts generally read a sustained break below one as the end of that pattern.
DOGE’s intraday low was $0.0725. The nearest support area is between $0.072 and $0.073, followed by major support near $0.068.
Dogecoin Network Activity Declines
Dogechain, a public block explorer, shows that the network processed about 156,972 transactions during the week beginning October 28, down 41% from the same week a year earlier. Average daily active addresses were approximately 32,659, a decline of about 42% year over year. The network also recorded 61,510 new addresses during the week, down 55% from the comparable period last year.
Lower blockchain activity does not necessarily result in lower prices. DOGE is heavily influenced by exchange trading, meaning its market price and network usage can move independently — on-chain figures track direct use of the ledger, while market prices are set on trading venues.
Markets also responded to the US midterm elections. Reuters reported on November 4 that Democrats had won control of both chambers of Congress. Bitcoin and Ethereum initially declined after the results. DOGE often experiences larger moves than the bigger cryptocurrencies during periods of market volatility.
Development across the Dogecoin ecosystem is continuing. On October 21, House of Doge announced an agreement to support the new Dogecoin Labs. The initiative brings together MyDoge, a consumer wallet application, and DogeOS, an Ethereum Virtual Machine-compatible layer designed to bring smart-contract functionality to Dogecoin. EVM compatibility is the standard that lets Ethereum-style smart contracts run on other networks. House of Doge also plans to expand its tokenization work focused on alternative investments.
US Dogecoin ETF Inflows Remain Limited
According to CryptoETF.today, US Dogecoin ETFs had recorded approximately $15.1 million in total net inflows as of November 2. The funds held roughly $12.9 million in total assets. In an ETF structure, creations and redemptions are the mechanism through which investor capital enters or exits a fund, so flow totals serve as a running record of net investor activity.
The tracker reported no net creations or redemptions on November 2. Over the previous 30 trading sessions, net inflows totaled about $1.8 million. Some funds had not completed their reporting, so the figures could change.
On the daily chart, DOGE was rejected near $0.10 in late September. The token had been recording higher lows after finding support around $0.07 in August. It then fell below the trendline near $0.085 in early October and has formed lower highs since then.
Momentum indicators remain weak. The Relative Strength Index (RSI) stood at 36.47, below the neutral 50 level but above the oversold threshold of 30. The Moving Average Convergence Divergence (MACD) line was near -0.0027, slightly above its signal line at -0.0028, while the histogram was near zero. The RSI gauges momentum on a 0-to-100 scale, while the MACD tracks shifts in trend momentum by comparing two moving averages.
Trader Tardigrade Points to Monthly Oscillator
Analyst Trader Tardigrade, who posts on X as @TATrader_Alan, assessed DOGE on the monthly chart and said the token had returned to a “discount zone.” He wrote:
$DOGE /monthly #Dogecoin is sitting in the discount zone again ❇️ The last time the oscillator spent this long down here, it marked the bottom before the next big run. The same setup is playing out now, and the window is closing fast. Catch the opportunity before it's too late…
— Trader Tardigrade 🧬 (@TATrader_Alan) November 4, 2026
https://x.com/TATrader_Alan/status/2117853242382319696?ref_src=twsrc%5Etfw
He said the previous period in which the oscillator remained at similarly low levels for an extended time marked a bottom before the next major run, adding that the same setup was now developing again. Monthly charts are among the broadest intervals technical analysts track, and oscillator readings on that timeframe update slowly, with each data point reflecting a full month of price action.
A move back above $0.0792 would leave resistance at $0.083 to $0.085, where the broken trendline is located. Higher levels include $0.09 and the $0.095 to $0.10 range. On the downside, a daily close below $0.068 would bring $0.065 and $0.06 into focus. The $0.068 level provided support during August’s consolidation.
DOGE was trading near $0.075 on Wednesday, with the $0.072 to $0.073 range representing the nearest support area.
Source: CoinCentral

