Dogecoin Holds Key Support as Bulls Target $0.081 Breakout
Key Takeaways
- •Dogecoin traded near $0.072 on July 28, with buyers defending the area around $0.07 after a prolonged selloff.
- •Analysts see $0.05 as the key invalidation level, while a close below it would weaken the bullish setup and expose lower price levels.
- •Trader Tardigrade highlighted bullish RSI divergence and a break above a descending trendline near $0.072 as signs that sellers may be losing control.
- •Ali Charts identified $0.0813 as the first major resistance, followed by higher supply zones near $0.0887, $0.1257, $0.1478, $0.1626 and $0.1774.
- •Javon Marks compared the current structure with prior Dogecoin cycles and said larger upside projections would depend on DOGE first holding support and clearing key resistance levels.
Dogecoin price is holding near $0.07 support as analysts monitor a possible recovery toward $0.081 and later resistance levels near $0.177. RSI divergence, a trendline breakout and improving momentum have led some market watchers to say DOGE may be forming a short-term reversal structure.
The token attempted to stabilize after a prolonged decline that erased more than 70% from its previous swing high. Buyers reappeared near $0.07, which several analysts described as a major macro support zone. DOGE traded near $0.072 on July 28, with a market capitalization of roughly $12.3 billion.
The rebound has been supported by price structure, Relative Strength Index behavior and comparisons with earlier market cycles. Even so, DOGE still needs to clear nearby resistance before any broader trend reversal can be confirmed, making the coming sessions important for gauging whether the base around current levels can hold.
Dogecoin Defends a Critical Floor
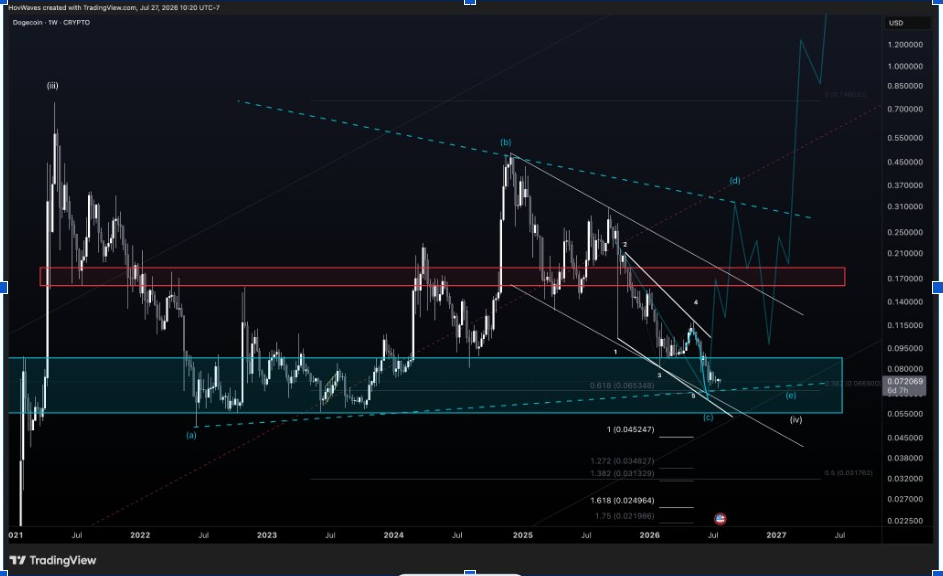
Dogecoin is trading near $0.072 after briefly testing the upper end of a broad support zone between $0.055 and $0.081. HovWave’s weekly chart places this area at the center of the current macro setup, with $0.05 serving as the key invalidation level.
The chart also shows price completing a five-wave decline within a descending structure. The projected path leaves room for another test of support before a larger rebound, indicating that short-term volatility may continue even if the broader base remains intact.
A higher-time-frame close below $0.05 would weaken the bullish case and expose lower Fibonacci levels near $0.045, $0.035 and $0.031. If the floor holds, HovWave still sees a fifth-wave target near $4.20. The setup therefore separates immediate downside risk from a much larger speculative cycle target.
DOGE Momentum Signals Improve
Trader Tardigrade pointed to three bullish signals on the daily chart. DOGE made a lower price low while RSI formed a higher low, creating bullish divergence after weeks of selling pressure.
RSI also moved above horizontal resistance, while price broke above a descending trendline near $0.072. Together, these signals suggest sellers may be losing control, although the breakout still requires follow-through and stronger volume.
The daily structure now favors a recovery toward the next overhead levels if DOGE continues to close above the broken trendline. A move back below the recent low would weaken the divergence and put the breakout at risk. Holding above $0.07 would help confirm that buyers are building a short-term base.
First Major Test Stands at $0.081
Ali Charts identified $0.0813 as the first meaningful resistance level through the URPD profile. That zone contains the largest nearby concentration of previously acquired DOGE, making it an area where holders may sell into strength.
A clean move above $0.081 could open the way toward $0.0887 before attention shifts to higher supply clusters. The next major zone is near $0.1257, followed by $0.1478 and $0.1626.
The strongest concentration of distant supply appears around $0.1774. Reaching that area would require DOGE to clear several stacked resistance bands, although the distribution profile shows relatively lighter positioning in some of those zones. Current trading near $0.0739 also explains why the first breakout test sits only slightly above market price.
Historical Cycles Point to Larger Targets
Javon Marks compared the current structure with Dogecoin’s 2017 and 2021 cycles. In both cases, DOGE moved beyond the 1.618 Fibonacci extension after building a prolonged base and entering a new expansion phase.
In the current cycle, the 1.618 extension is near $2.85, with higher projections around $7.22 and $13.99. Marks said a repeat move above 1.618 would require a gain of more than 3,800% from current levels.
Those projections remain highly speculative and depend on Dogecoin first holding macro support, reclaiming $0.081 and breaking the $0.177 supply wall. For now, the main watchpoints are whether the recent trendline break can hold, whether volume improves on any rebound, and whether price can stay above $0.05 to preserve the broader support structure.