Dogecoin Golden Cross Highlights $0.056 Support and $0.16 Recovery Target
Key Takeaways
- •Dogecoin’s hourly chart showed a golden cross as the 50-period moving average moved above the 200-period moving average.
- •DOGE recovered from around $0.068 on July 24 but later traded near $0.072 after losing its daily gain.
- •Analyst Ali identified $0.056 as Dogecoin’s main support zone and $0.16 as the primary upside target if buyers maintain momentum.
- •TD Sequential buy signals appeared on Dogecoin’s monthly, weekly, three-day, and daily charts, according to Ali.
- •Upcoming Federal Reserve, inflation, and GDP data, along with Ethereum’s strength versus Bitcoin, may affect broader crypto risk appetite.
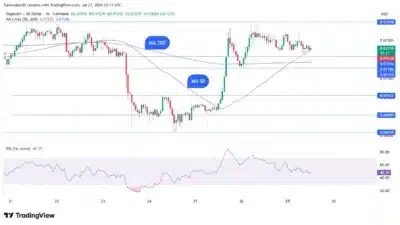
Dogecoin has formed a short-term golden cross on its hourly chart, giving traders another technical marker as they assess whether the meme coin can extend its recent recovery attempt. The signal appeared after the 50-period moving average moved above the 200-period moving average, a crossover that technical traders often use to track improving market momentum.
The development came even as DOGE gave back part of its weekend gains. Dogecoin began rebounding from around $0.068 on July 24, before buying activity strengthened over the weekend. Several other meme coins also advanced during the same period, contributing to a stronger tone across parts of the broader crypto market. However, Dogecoin later erased its daily increase and traded near $0.072, reflecting renewed selling pressure after the rally lost momentum.
Although an hourly golden cross is a short-term indicator, it has kept attention on whether buyers can defend current levels and build a broader recovery. Because moving-average crossovers are based on past price action, traders often monitor follow-through volume and support retests to assess whether the signal is developing into a stronger trend or fading after a brief move. Traders are now watching whether DOGE can hold above key support areas after the latest pullback.
Technical Indicators Put Key Dogecoin Levels in Focus
Beyond the hourly moving-average crossover, another technical signal has drawn attention. Crypto analyst Ali said the TD Sequential indicator has produced buy signals on Dogecoin’s monthly, weekly, three-day, and daily charts. The TD Sequential is commonly used by technical traders to identify potential trend exhaustion and reversal points, though such signals do not confirm a reversal on their own. Such alignment across multiple timeframes is relatively uncommon and has increased interest among technical traders following the asset.
According to Ali, $0.056 remains Dogecoin’s main support zone. A sustained hold above that level could strengthen the recovery structure and raise the probability of a move toward $0.16, which he identified as the primary upside target if buyers maintain momentum above important levels. Ali also pointed to the upper boundary of a broader trading channel near $0.45 as a longer-term upside target if bullish momentum continues to develop.
Still, the decline from weekend highs indicates that buyers continue to face resistance. As a result, whether Dogecoin can maintain support above current levels is likely to be an important factor in determining whether the technical signals translate into a more sustained price advance.
Macro Data and Ethereum Strength Add Broader Market Context
Broader financial-market conditions may also influence Dogecoin’s next move. Investors are monitoring the Federal Reserve’s upcoming interest rate decision, with economists widely expecting policymakers to leave rates unchanged at 3.75%. Traders are also preparing for the latest core PCE inflation data and quarterly GDP figures, both of which could affect risk appetite across financial markets.
That macro backdrop matters for crypto assets because expectations for interest rates and inflation can influence demand for risk assets, including tokens with limited cash-flow anchors. Dogecoin, as a meme coin, can be especially sensitive to shifts in speculative appetite and broader altcoin liquidity, making market-wide conditions relevant alongside chart-based signals.
At the same time, Ethereum has strengthened against Bitcoin in recent weeks, adding support to the wider altcoin market. The ETH/BTC trading pair has moved above its 200-day simple moving average for the first time since January and has gained more than 20% since recovering in June. Some market observers view Ethereum’s relative strength as a factor that could encourage additional interest in alternative cryptocurrencies, including Dogecoin.
Dogecoin’s hourly golden cross has introduced a fresh short-term technical signal, while multiple TD Sequential buy signals have reinforced attention on the token’s recovery setup. With the recent rally paused, traders remain focused on the $0.056 support level and the potential path toward $0.16 if buying momentum strengthens.

