DeFi in 2026 by the Numbers: Total Value Locked, DEX Volume and Hack Losses
Key Takeaways
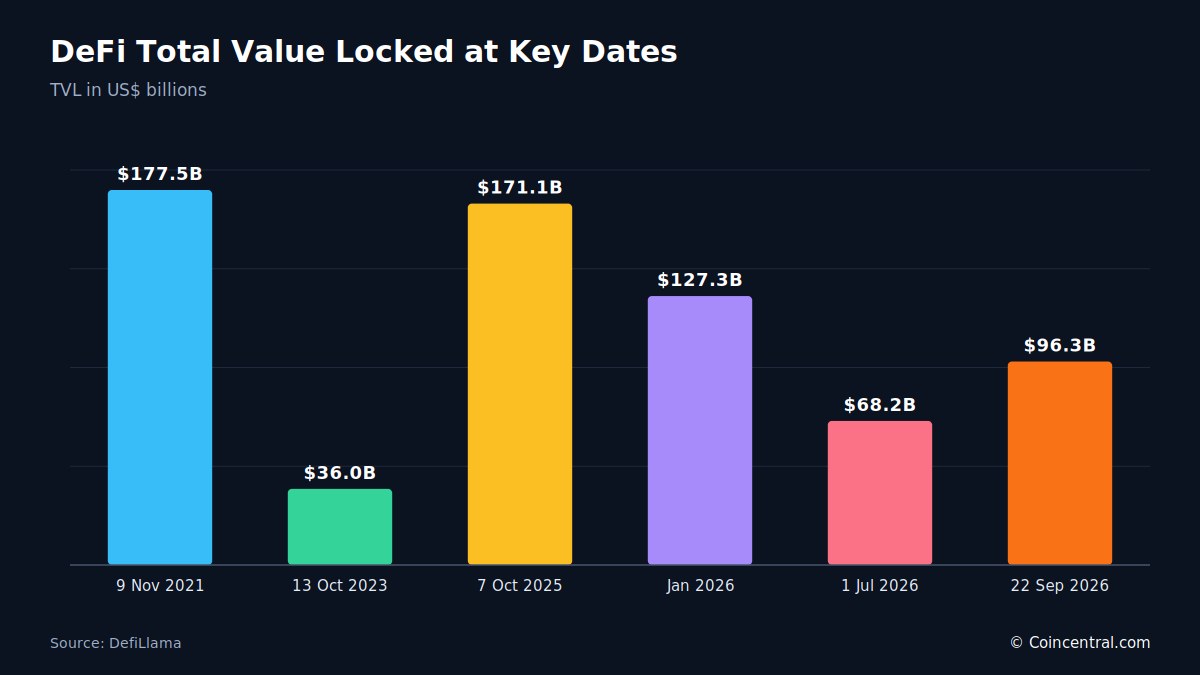
- •DeFi's total value locked reached $96.3 billion on 22 September 2026, recovering about 41% from the 1 July low of $68.2 billion but remaining 45.7% below the record $177.5 billion set in November 2021.
- •Ethereum holds 56.4% of all DeFi value, Lido leads protocols with $25.998 billion, and liquid staking at $58.59 billion has become the sector's largest activity by value, surpassing lending's $55.73 billion.
- •Decentralized exchanges traded $2.24 trillion in 2026 through 23 September, and the DEX share of spot volume against centralized exchanges stands at a record or near-record 22% to 27% depending on the data provider.
- •Stablecoins reached a combined market cap of about $305 billion, roughly 3.2 times total DeFi TVL, with Tether's USDT accounting for 60.08% of the supply.
- •Security losses declined in the first half of 2026, with TRM Labs counting $972 million across 207 hacks versus $2.3 billion across 83 a year earlier, though single events like the $291 million Kelp DAO compromise still dominated totals.
Decentralized finance (DeFi) lets people lend, borrow, trade and earn interest through software rather than a bank. According to DefiLlama, $93.9 billion was locked in DeFi protocols on 21 September 2026, and a day later the figure stood at $96.3 billion. That level is 45.7% below the November 2021 peak of $177.5 billion and equals about 3.3% of the $2.96 trillion cryptocurrency market.
This overview draws on DefiLlama, CertiK, TRM Labs, Chainalysis and several research firms. Every figure is paired with its date and source, because numbers in this field change daily and providers often count different things.
How Much Value Is Locked in DeFi?
Total value locked (TVL) is the dollar value of assets deposited in DeFi protocols, and it remains the sector's most widely used yardstick. DefiLlama tracked 6,572 protocols on 21 September 2026.
The historical arc is well defined. TVL hit a record $177.49 billion on 9 November 2021, fell to a low of $36.03 billion on 13 October 2023, and then climbed to $171.06 billion on 7 October 2025, within reach of the old record.
The year 2026 brought a sharp swing. TVL stood near $127.3 billion in January, dropped to $68.2 billion on 1 July, and then rose about 41% to $96.3 billion on 22 September.
A June snapshot traces the same path. CoinLaw reported $71.77 billion across 453 chains on 18 June, down 37.3% from 1 January and 34.6% from a year earlier, and logged a year-to-date low of $69.4 billion on 7 June. Small gaps between sources come from different snapshot days, but the direction is the same in each dataset: a steep fall in the first half of 2026 and a partial recovery since July.
Why TVL Moves With Token Prices
TVL is measured in dollars, so when token prices fall, TVL falls too, even if nobody withdraws anything. That makes the metric partly a price chart. Over the period when total DeFi TVL fell 43.7%, ether fell 41.3%, from $4,687 to $2,753, and the two moved almost together. Ethereum's own chain TVL is down 49.3% in dollar terms since November 2021.
Much of the drop seen in TVL charts therefore reflects lower prices, not only money leaving the sector, and readers should keep this in mind when comparing TVL across dates.
There is a second limitation. The Bank for International Settlements tried to rebuild TVL for 400 protocols on its own and matched the published figure for only 46.5% of them, while about one protocol in ten relies on off-chain data that cannot be checked. TVL is the best number the industry has, but it is not an audited one.
DeFi TVL by Blockchain
Ethereum holds the most DeFi value by a wide margin. DefiLlama listed $52.742 billion on Ethereum on 21 September 2026, with Solana second at $6.211 billion and Base third at $5.903 billion. A second DefiLlama pull on 22 September put Ethereum at $54.42 billion, or 56.4% of all TVL, with the top five chains holding 81.7%. Ethereum's share was 53.1% in June, so its lead has grown.
A concentration this heavy means the sector-wide totals quoted throughout this article move mainly with deposits and withdrawals on Ethereum itself, so the chain-level figures are as important to follow as the aggregate.
Over the month to 21 September, Ethereum gained 11.17%, Solana rose 16.23% and Base climbed 12.49%, while Hyperliquid L1 fell 4.66%. Robinhood Chain posted the biggest monthly jump, up 77.81% to $999.62 million. Tron holds $5.62 billion across just 67 protocols, while Ethereum hosts 2,014.
Top DeFi Protocols and Categories
Lido leads the protocol rankings with $25.998 billion in TVL, followed by Aave at $19.187 billion and Morpho at $10.728 billion. Where DefiLlama shows a category, liquid staking and lending protocols fill five of the top ten spots. Ethena had the fastest monthly growth in the top ten, up 20.80%, while Spark fell 7.19% and Sky fell 1.43%.
A newer group is risk curators, firms that set the lending rules for pooled funds. DefiLlama lists $10.26 billion managed by 86 of them, about 10.6% of all DeFi TVL. Steakhouse Financial manages $3.11 billion, Sentora $2.70 billion and Gauntlet $1.64 billion, which puts many lending choices in the hands of a small group.
Tokenized real-world assets are also growing. DefiLlama tracked $29.852 billion in active RWA assets under management on 21 September. In June, RWA TVL was $26.01 billion, led by Circle's USYC at $3.07 billion and BlackRock's BUIDL at $3.03 billion. The two largest positions belong to a stablecoin issuer and a traditional asset manager, which shows where tokenized-asset issuance has concentrated so far.
Category totals depend on the date and on how each site groups protocols. In June, CoinLaw ranked bridges first at $45.38 billion, ahead of lending at $36.50 billion. These figures are best treated as estimates.
Lending and Liquid Staking
Liquid staking is now the largest activity in DeFi by value, holding $58.59 billion across 295 protocols. Lending protocols hold $55.73 billion in supplied funds across 646 protocols.
Lido makes up 45.9% of liquid staking, Binance staked ETH has 17.5% and ether.fi has 8.8%. Lido's own API shows 9,760,387 ETH staked from 627,394 holders at a 2.21% return. On Ethereum as a whole, about 43.7 million ETH is staked, which is roughly 35.8% of supply, earning about 2.6% a year.
In lending, $30.99 billion of the $55.73 billion supplied is borrowed, a utilization rate of 55.6%. Aave V3 holds $18.67 billion, Morpho Blue $11.02 billion and SparkLend $5.80 billion. The segment is concentrated: in June, the top five lending protocols held about 75% of lending TVL and Aave V3 alone held about 33%, and Mordor Intelligence says the top 10 lending protocols hold 89% of TVL in that segment.
DEX Trading Volume
Decentralized exchanges (DEXs) let people swap tokens straight from their wallets. They traded $4.91 trillion in 2025 and $2.24 trillion in 2026 up to 23 September, and all-time DEX volume stands at $14.01 trillion. Annual volume was $1.86 trillion in 2021 and $0.90 trillion in 2023. Monthly volume fell from about $409 billion in 2025 to about $256 billion in 2026, a drop of roughly 37%.
On 21 September, DEXs handled $8.348 billion in 24 hours and $63.042 billion over seven days. Perpetual futures venues did $16.181 billion in a day and $155.319 billion over seven days, up 20.91% for the week.
Uniswap leads by a wide margin: its V3 and V4 pools did $90.1 billion over 30 days, ahead of PancakeSwap at $19.6 billion, PumpSwap at $18.4 billion and Aerodrome at $12.9 billion.
Is the DEX Share of Trading at a Record?
The DEX-to-CEX ratio is a rough gauge of how much spot trading is executed on-chain rather than through intermediaries, which makes it one of the clearest measures of DeFi's pull on wider trading activity.
Sources disagree. One data pull put DEX trading at 27.1% of spot volume against centralized exchanges, the highest on record and up from about 7.5% in March 2023, while DefiLlama's dashboard showed 22.38% on 21 September. The Defiant reported 24.14% for July 2026 using The Block's data, the highest since the series began in 2019, and noted the ratio was below 10% for most of 2024 and between 18% and 21% in the first half of 2026. The Block's own August 2025 report showed 27.9% for June 2025 and 23.3% for July 2025.
Whether July 2026 is a record therefore depends on which series is used. What is clear is that DEXs hold a larger share of a smaller market than they did in 2025.
Stablecoin Supply
Stablecoins are tokens pegged to the US dollar. DefiLlama showed a market cap of $305.104 billion on 21 September 2026, up 0.74% over 30 days, with Tether's USDT holding 60.08% of the total. Another pull put the market at $314.2 billion across 427 coins, with Tether and Circle at a combined 82.4%. The gap comes from different dates and different lists of coins.
USDT stands at $183.308 billion and USDC at $74428 billion. Sky Dollar ranks third at $6.538 billion, and Ethena's USDe grew 18.72% in a month to $4.877 billion. Ethereum carries $147.027 billion in stablecoins and Tron $94.452 billion, and Tether's own data shows 50.4% of USDT sits on Tron and 47.3% on Ethereum. Tron's stablecoin supply is about 17 times its DeFi TVL of $5.62 billion, while across the market, stablecoins are about 3.2 times total DeFi TVL. CoinLaw's June report says most stablecoin supply moves outside DeFi protocols, which makes stablecoin figures a gauge of dollar-pegged liquidity across the whole market rather than a DeFi statistic, and explains why they are tracked separately from TVL.
The fee data points the same way. DefiLlama shows $23.93 billion in fees earned across the ecosystem over 12 months, and the two biggest earners are Tether and Circle, which collect income on the reserves behind their coins. The BIS estimates $28 trillion in stablecoin transaction volume in 2025, against a market cap near $320 billion, though bots inflate volume figures like this, so they should be read with care.
DeFi Hacks and Losses
DefiLlama counts $1.84 billion stolen across 274 incidents in 2026 up to 22 September, of which DeFi protocols account for $1.17 billion across 198 incidents. That is 64% of the money and 72% of the incidents.
CertiK counted $1,315,676,432 lost across 344 Web3 incidents in the first half of 2026, and its scope covers all Web3 security events, not DeFi alone. In the first half of 2025, losses were $2,473,576,952 across 345 incidents, with the $1.45 billion Bybit hack making up 58.7% of the 2025 total. CertiK says first-half 2026 losses are about 28% higher once Bybit is removed.
Two April 2026 events led the list: the Kelp DAO RPC compromise cost $291 million and the Drift Protocol breach cost $285 million, together making up nearly 44% of first-half losses. Ethereum logged 153 incidents and $522,814,367 in losses, while Solana lost $315,069,960, mostly from the Drift exploit. Frozen and returned funds totaled $115,311,507, which leaves adjusted losses of $1,200,364,925 and a median loss per incident of $138,703. Wallet compromises and phishing caused far more dollar loss than code flaws, even though code flaws were the most common incident type.
Is the Trend Improving?
TRM Labs counted 207 hacks for $972 million in the first half of 2026, against 83 hacks for $2.3 billion in the first half of 2025. There were more incidents but far less money lost. Immunefi's review of 2020 to 2025 shows exploit losses down 74% from the 2022 peak, with the median loss per exploit falling from $6 million to $1.5 million. Chainalysis put total stolen funds above $3.4 billion in 2025, linked $2.02 billion to North Korea-linked actors, and found that centralized services, not DeFi, took the bulk of the largest losses.
DeFi Market Size and Forecasts
TVL measures money held, while market size reports measure something else, usually revenue under each firm's own scope. That is why the estimates vary so much.
Precedence Research sizes the DeFi market at $49.77 billion in 2026, up from $32.36 billion in 2025, and projects $1,976.09 billion by 2035, a yearly growth rate of 50.86%. Fortune Business Insights uses a wider definition, sizing the market at $107.94 billion for 2026 and projecting $695.44 billion by 2034 at 26.20% a year. Mordor Intelligence estimates $238.54 billion in 2026 and $770.56 billion by 2031, a 26.43% yearly rate. These totals are not three views of one number. Statista's DeFi page hides most figures behind a paywall, so they are not used here.
Regions and Segments
Fortune says North America made up $46.46 billion, or 53.70%, of its market in 2025, and it projects $56.31 billion for 2026. Precedence puts the US at $8.98 billion in 2025, rising to $560.05 billion by 2035. Mordor gives North America a 42.78% share in 2025 and expects Asia-Pacific to grow fastest, at 31.89% a year through 2031.
By segment, Mordor says lending and borrowing protocols held 27.33% of the market in 2025, and tokenized RWA platforms are forecast to grow 39.72% a year. Retail users held 62.12% of the market, while institutional users are forecast to grow 32.55% a year.
How Many People Use DeFi?
No one can give a clean count of DeFi users. One person can run many wallet addresses, and bots run millions more, so addresses are not people. a16z estimates 40 million to 70 million real active crypto users, against 181 million monthly active addresses, and its own work found that only a small share of addresses map to distinct people. DeFi users are a subset of that group, but the size of the subset is not measured. Any page that gives one exact DeFi user figure is likely guessing.
What the DeFi Data Shows
DeFi in late 2026 holds about $96 billion, far below the 2021 and 2025 highs. Ethereum holds more than half, and liquid staking is now larger than lending. DEXs hold a record or near-record share of spot trading, even as their volume fell. Stablecoins are about three times the size of DeFi TVL, and two issuers dominate them. Hack losses were lower in the first half of 2026 than a year earlier, although single large events still drive the totals. Market size estimates range from $49.77 billion to $238.54 billion, so the source always matters. Quote every figure with its date.
None of this amounts to a forecast. For readers tracking the sector from here, the indicators to watch are the TVL recovery that began in July, the DEX share of spot volume, stablecoin supply, RWA assets under management and the periodic security tallies from CertiK, TRM Labs and Chainalysis, all of which are updated on the public dashboards listed under Sources.
Sources
- DefiLlama
- DefiLlama Stablecoins
- CoinGecko
- CoinLaw
- Statista Market Insights: DeFi
- Precedence Research: Decentralized Finance Market
- Fortune Business Insights: Decentralized Finance Technology Market
- Mordor Intelligence: Decentralized Finance (DeFi) Market
- CertiK: Hack3D H1 2026 Report
- TRM Labs
- Chainalysis
- Immunefi
- Bank for International Settlements
- a16z State of Crypto
- The Block
- The Defiant
- Lido
- ultrasound.money
- Original report: DeFi Statistics 2026 – CoinCentral

