2026 Week 31 Crypto Market Watch: Bitcoin Slides as Spot Demand Weakens and Altcoin Breadth Splinters
Key Takeaways
- •Total crypto market capitalization declined approximately $60 billion to $2.14 trillion in Week 31, with Bitcoin falling 2.63% to $63,044 and closing near its weekly low.
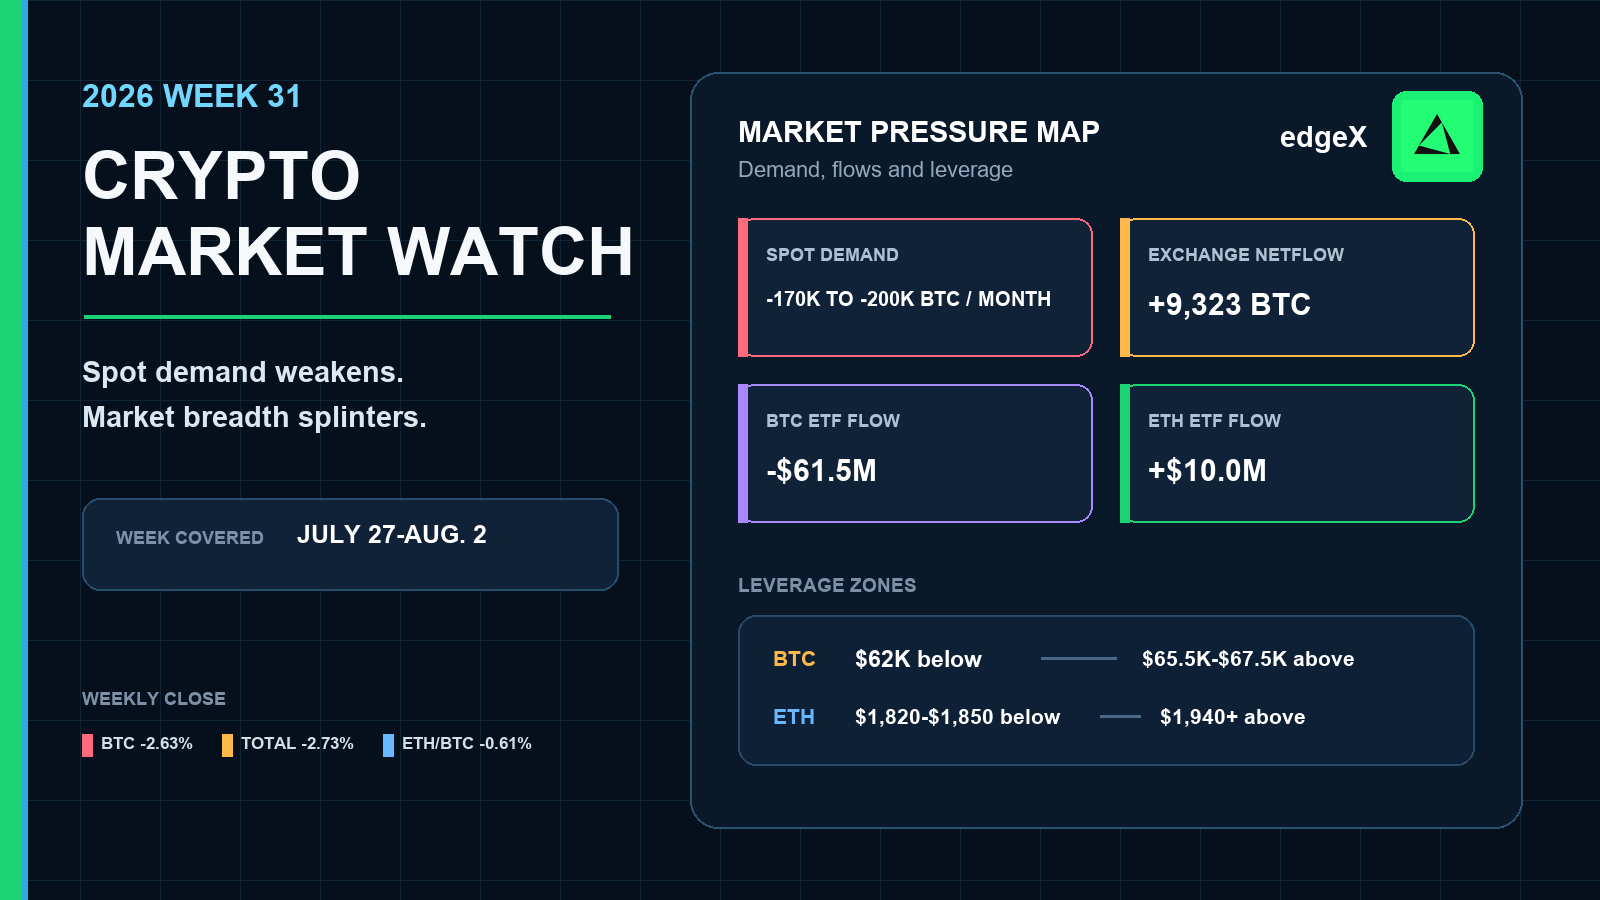
- •CryptoQuant's 30-day spot-demand measure signaled a monthly contraction of 170,000–200,000 BTC, indicating that organic buying was insufficient to absorb available supply.
- •Exchange netflow turned decisively positive with five consecutive days of inflows totaling 9,323 BTC, increasing readily tradable supply just as demand weakened.
- •U.S. spot Bitcoin ETFs recorded $61.5 million in net outflows while Ether ETFs posted $10 million in net inflows, yet ETH/BTC still declined 0.61%, preventing any rotation thesis from developing.
- •Altcoin performance was sharply dispersed rather than broad-based, with ADA gaining 14.27% and BNB rising 2.27% while HYPE plunged 11.85% and LINK fell 5.02%.
Crypto Entered August With Less Demand Than the Price Suggested
Crypto’s Week 31 close looked orderly. The underlying data were less reassuring.
Total market capitalization moved from $2.20 trillion at the start of July 27 to $2.14 trillion at the end of August 2, a loss of approximately $60 billion. The market reached a weekly high near $2.22 trillion, tested roughly $2.12 trillion, and finished only $20 billion above that low. Bitcoin followed a similar path, falling from $64,747 to $63,044 on the UTC boundary readings used for this review.
Those moves were not large enough to signal disorder. They were large enough to expose a demand problem. CryptoQuant's 30-day spot-demand measure remained deeply negative, indicating contraction of roughly 170,000 to 200,000 BTC per month. At the same time, exchange netflow turned decisively positive late in the week. Price held above the lowest visible liquidity pocket, but the market had less organic absorption beneath it.
This distinction matters. A market supported by durable spot accumulation can usually absorb leverage resets and exchange deposits with less damage. A market leaning more heavily on derivatives can remain stable for a while, but it becomes more sensitive to funding, liquidations, and abrupt changes in positioning. Week 31 did not prove that Bitcoin was breaking down. It showed that the quality of its support had weakened.
Week 31 Crypto Dashboard
| Signal | Week 31 Reading | Market Interpretation |
|---|---|---|
| Total crypto market cap | $2.20T to $2.14T (-2.73%) | Market value contracted and closed near the weekly low |
| Total market-cap range | $2.12T-$2.22T | A roughly 4.72% high-to-low range |
| Bitcoin | $64,747 to $63,044 (-2.63%) | BTC weakened but avoided a decisive range failure |
| BTC dominance | 59.11% to 58.96% | Bitcoin's share fell only 0.15 percentage points |
| ETH/BTC | 0.02963 to 0.02945 (-0.61%) | Ether underperformed Bitcoin |
| BTC exchange netflow | +9,323 BTC | Late-week deposits increased available exchange supply |
| U.S. spot Bitcoin ETF flow | -$61.5M | Institutional wrapper demand was negative overall |
| U.S. spot Ether ETF flow | +$10.0M | Positive, but too small to produce ETH leadership |
The dashboard resists a simple label. Market value and Bitcoin both fell, yet BTC dominance did not rise. Ether ETFs stayed positive, yet ETH/BTC declined. A few altcoins rallied sharply, yet most of the large-cap tape remained weak. Week 31 was therefore neither a clean defensive Bitcoin market nor a convincing altcoin rotation. It was a selective, liquidity-constrained retreat.
Bitcoin’s Demand Structure Was the Week’s Central Risk
Bitcoin's 2.63% decline was modest compared with many crypto drawdowns. The more important signal came from the forces beneath price.
CryptoQuant’s 30-day spot-demand measure suggested that organic buying remained too weak to absorb available supply consistently. That does not mean every futures-supported rally must fail. It means traders should place a lower confidence level on price stability that is not confirmed by spot demand. When derivatives carry more of the load, a calm chart can conceal a more fragile market structure.
Exchange deposits accelerated into the selloff
CryptoQuant’s daily exchange-netflow series started the week with net withdrawals of roughly 2,675 BTC on July 27 and 3,565 BTC on July 28. The direction then reversed. Exchanges recorded five consecutive net-inflow days, producing approximately 9,323 BTC of cumulative inflows for the full week.
The most important day was July 31. Net inflows reached approximately 6,658 BTC as the corresponding CryptoQuant chart price fell from about $64,726 on July 30 to $62,825. Coins sent to exchanges are not automatically sold, and transfers can reflect collateral management or internal positioning. Even with that caveat, the timing increased the risk that readily tradable supply was arriving as demand weakened.
The whale-retail gap narrowed after the midweek peak
CryptoQuant’s Whale vs. Retail Delta remained positive throughout Week 31 and climbed to 0.347 on July 30. It then dropped to 0.153 on August 1 before recovering modestly to 0.183 on August 2. The weekly average was approximately 0.251.
The indicator should not be treated as proof that whales bought while retail sold. Its more defensible message is relative: the gap between the two cohorts strengthened into Bitcoin's midweek high and then narrowed sharply during the retreat. That loss of relative support aligned with the exchange-inflow shift and reinforced the view that the market entered August with a thinner cushion.
Ether Could Not Convert ETF Demand Into Leadership
BTC dominance fell from 59.11% to 58.96%, but ETH/BTC also declined from 0.02963 to 0.02945. Ether briefly pushed the ratio as high as 0.03015, then failed to hold the move and ended close to the weekly low of 0.02933.
This combination is important because a falling Bitcoin-dominance reading is often interpreted too quickly as an altcoin signal. Week 31 did not show a clean transfer of leadership from BTC to ETH. Bitcoin lost a small amount of market share, but Ether lost ground against Bitcoin at the same time. Some of the relative movement therefore came from assets outside the two largest cryptocurrencies, while part of it reflected changes in stablecoin and broader market capitalization.
ETF flows deepened the puzzle. Farside Investors recorded approximately $61.5 million of net outflows from U.S. spot Bitcoin ETFs across July 27-31. The weekly total included a $233.1 million inflow on July 30, followed by a $265.4 million outflow on July 31. Spot Ether ETFs ended the five sessions with approximately $10 million of net inflows, despite a $32.9 million outflow on July 29.
Positive Ether ETF flow was therefore not enough. It softened the institutional-demand picture for ETH, but it did not overcome weak relative price action. A stronger rotation would require the ETF bid and ETH/BTC to move in the same direction.
Altcoin Breadth Was Defined by Dispersion, Not Expansion
CoinMarketCap’s August 2 historical snapshot captured a market with unusually wide differences between large assets. Bitcoin was down 2.84% over seven days and Ether was down 3.63%. XRP lost 2.43%, SOL fell 4.12%, DOGE declined 3.57%, and LINK dropped 5.02%. HYPE was the weakest major name in the snapshot, falling 11.85%.
There were exceptions. ADA advanced 14.27%, BNB gained 2.27%, and XMR rose 2.93%. Those gains matter because they explain how Bitcoin dominance could edge lower even as ETH/BTC weakened. They do not establish a broad altcoin season. A healthy market-wide rotation normally combines falling BTC dominance, stronger ETH/BTC, expanding total market capitalization, and improving participation across multiple sectors. Week 31 delivered only fragments of that pattern.
| Asset | Seven-Day Move | Breadth Signal |
|---|---|---|
| ADA | +14.27% | Strong idiosyncratic leadership |
| XMR | +2.93% | Defensive or project-specific relative strength |
| BNB | +2.27% | Large-cap resilience |
| XRP | -2.43% | Tracked the broader contraction |
| SOL | -4.12% | High-beta layer-one demand stayed weak |
| LINK | -5.02% | Infrastructure exposure did not broaden the rally |
| HYPE | -11.85% | Perpetual-DEX momentum suffered a sharp reset |
Stablecoin supply also failed to provide an obvious liquidity tailwind. CoinMarketCap's historical snapshots show the circulating supplies of USDT and USDC declining by a combined approximately $1.38 billion between July 26 and August 2. A one-week contraction is not a verdict on long-term crypto liquidity, but it fits the broader picture: capital was rotating selectively rather than expanding across the system.
Liquidation Maps Put Bitcoin and Ether Between Two Pressure Zones
CoinGlass's two-week Binance BTC/USDT liquidation heatmap, viewed on August 3, showed a significant liquidity concentration near $62,000 below the market. Overhead liquidity was visible around $63,000-$64,000, with a broader and denser band between roughly $65,500 and $67,500.
That left Bitcoin between competing magnets. A move through the lower concentration could accelerate long liquidations, while a recovery toward the upper bands could force shorts to unwind. These levels are estimates of leveraged-position concentrations, not guaranteed support, resistance, or price targets.
ETH's Binance heatmap showed a comparable structure. Lower liquidity was concentrated around approximately $1,820-$1,850, while more substantial overhead bands appeared near $1,940 and again around $1,980-$2,000. With ETH/BTC already weakening, Ether needed more than a bounce from the lower zone. It needed sustained relative strength through the overhead leverage to revive the rotation case.
The Federal Reserve Kept Liquidity Conditions Restrictive
The Federal Reserve held its target range at 3.50%-3.75% on July 29. The decision was notable for three dissenters who preferred a 25-basis-point increase. The statement described economic activity as solid while saying inflation remained elevated, partly because of energy-related supply shocks.
For crypto, that was not an easy-liquidity signal. A steady policy rate avoided an immediate tightening surprise, but the hawkish dissents and inflation language limited the case for rapid easing. That helps explain why isolated inflows and individual altcoin rallies did not turn into broad market expansion. Crypto entered August still needing stronger organic demand, not merely the absence of a new rate increase.
What Would Improve or Break the Week 32 Setup
The constructive scenario begins with spot confirmation. Bitcoin needs exchange netflow to moderate, spot demand to become less negative, and ETF flows to recover without relying on a single large day. Holding above the $62,000 liquidity concentration would reduce immediate liquidation risk, while a move through the mid-$65,000s would test whether overhead shorts can become fuel rather than resistance.
For market breadth, ETH/BTC needs to reclaim the 0.03015 Week 31 high while BTC dominance remains below 59.39%. That would be a cleaner sign that capital is rotating into Ether rather than scattering among isolated winners. TOTAL also needs to recover $2.22 trillion to show that rotation is being funded by expansion instead of redistribution.
The bearish scenario is more direct. Continued exchange inflows, another negative Bitcoin ETF week, and a break below $62,000 would expose the market to a deeper leverage reset. If ETH/BTC also loses 0.02933, Ether would be confirming weakness rather than offering diversification. In that environment, a few outperformers would not be enough to repair breadth.
Week 31's message is therefore less about predicting one breakout than judging the quality of the next move. Price can recover before spot demand does. A durable recovery should eventually bring demand, flows, breadth, and leverage structure back into alignment.
Trade Crypto With Leverage - Without Giving Up Custody
Decentralized perpetual exchanges have moved well past niche status. According to CoinGecko's 2025 Annual Crypto Report, DEX perpetual trading volume surged 346% last year, reaching $6.7 trillion, while centralized exchange open interest fell 20.8% over the same period. Traders are committing serious capital to on-chain derivatives, and the reasons are straightforward: counterparty risk is real, custodial failures happen, and censorship resistance matters.
edgeX is a decentralized perpetual futures exchange built for traders who want market access without sacrificing control. Here's what sets it apart:
- No KYC, no barriers. Connect a wallet and start trading. No identity verification or account approvals are required.
- True self-custody. edgeX combines off-chain order matching with verifiable on-chain settlement secured by Ethereum. Forced-withdrawal mechanisms keep funds recoverable directly from the blockchain even if the operator goes offline.
- Deep liquidity, tight spreads. edgeX maintains $10 million of market depth within a one-basis-point spread, with sub-0.1-basis-point slippage on trades exceeding $100,000.
- Up to 100x leverage. Traders can scale positions to match their risk framework, whether hedging exposure or trading momentum.
- 140% trading fee rewards. Active traders can earn rewards on their trading activity, reducing the net cost of frequent strategies.
- Institutional-grade infrastructure. edgeX processes up to 200,000 orders per second with matching latency below 10 milliseconds.
Start trading crypto perpetual futures on edgeX and put your market view to work.
Frequently Asked Questions
What dates does the Week 31 Crypto Market Watch cover?
The review covers July 27 through August 2, 2026, using UTC boundary readings. The CoinGlass liquidation maps were viewed on August 3 and are used only as forward-looking positioning context.
Why was Bitcoin's Week 31 structure considered fragile?
Bitcoin fell 2.63% while CryptoQuant's 30-day spot-demand measure remained deeply negative. Exchanges also recorded approximately 9,323 BTC of cumulative net inflows, increasing the amount of supply readily available for trading.
Did falling Bitcoin dominance signal an altcoin season?
No. BTC dominance fell only 0.15 percentage points, total market capitalization declined, and ETH/BTC lost 0.61%. A few altcoins outperformed, but participation was too narrow to confirm a market-wide altcoin season.
What did ETF flows show?
Farside Investors recorded approximately $61.5 million of net outflows from U.S. spot Bitcoin ETFs across July 27-31. Spot Ether ETFs posted approximately $10 million of net inflows, but ETH still underperformed Bitcoin.
Which altcoins stood out during Week 31?
CoinMarketCap's August 2 snapshot showed ADA up 14.27%, XMR up 2.93%, and BNB up 2.27%. HYPE fell 11.85%, LINK lost 5.02%, and SOL declined 4.12%, illustrating the week's unusually fragmented breadth.
What are the most important levels for Week 32?
Bitcoin's visible leverage zones sit near $62,000 below and approximately $65,500-$67,500 above. For broader rotation, ETH/BTC needs to recover its Week 31 high of 0.03015, while total market capitalization needs to reclaim approximately $2.22 trillion.

