Crypto Returns by Year: Bitcoin, Ethereum, Solana and XRP vs Stocks, Gold and Bonds
Key Takeaways
- •Between 2018 and 2025, major cryptocurrencies produced calendar-year gains that traditional assets never matched, including Ethereum's 436% in 2021, Solana's 889% in 2023 and Bitcoin's roughly 270% in 2020.
- •The same assets suffered severe drawdowns, with Bitcoin losing about 62% in 2022, Ethereum falling more than 80% in 2018 and Solana dropping roughly 93.8% in 2022.
- •Traditional markets showed far smaller swings, as the S&P 500's worst calendar year was a loss of about 18% in 2022 and the Nasdaq-100's steepest annual decline was roughly 32%.
- •When returns are compounded across the full 2018-2025 period, Bitcoin still ranked first, but Ethereum finished slightly behind the Nasdaq-100 and the gap between crypto and traditional assets proved much smaller than single best years suggest.
- •In 2026, leadership has reversed, with Bitcoin down about 4% to 5% by October 11 while the S&P 500 returned roughly 13.8% through October 2 and gold fell about 4.4% through September 30.
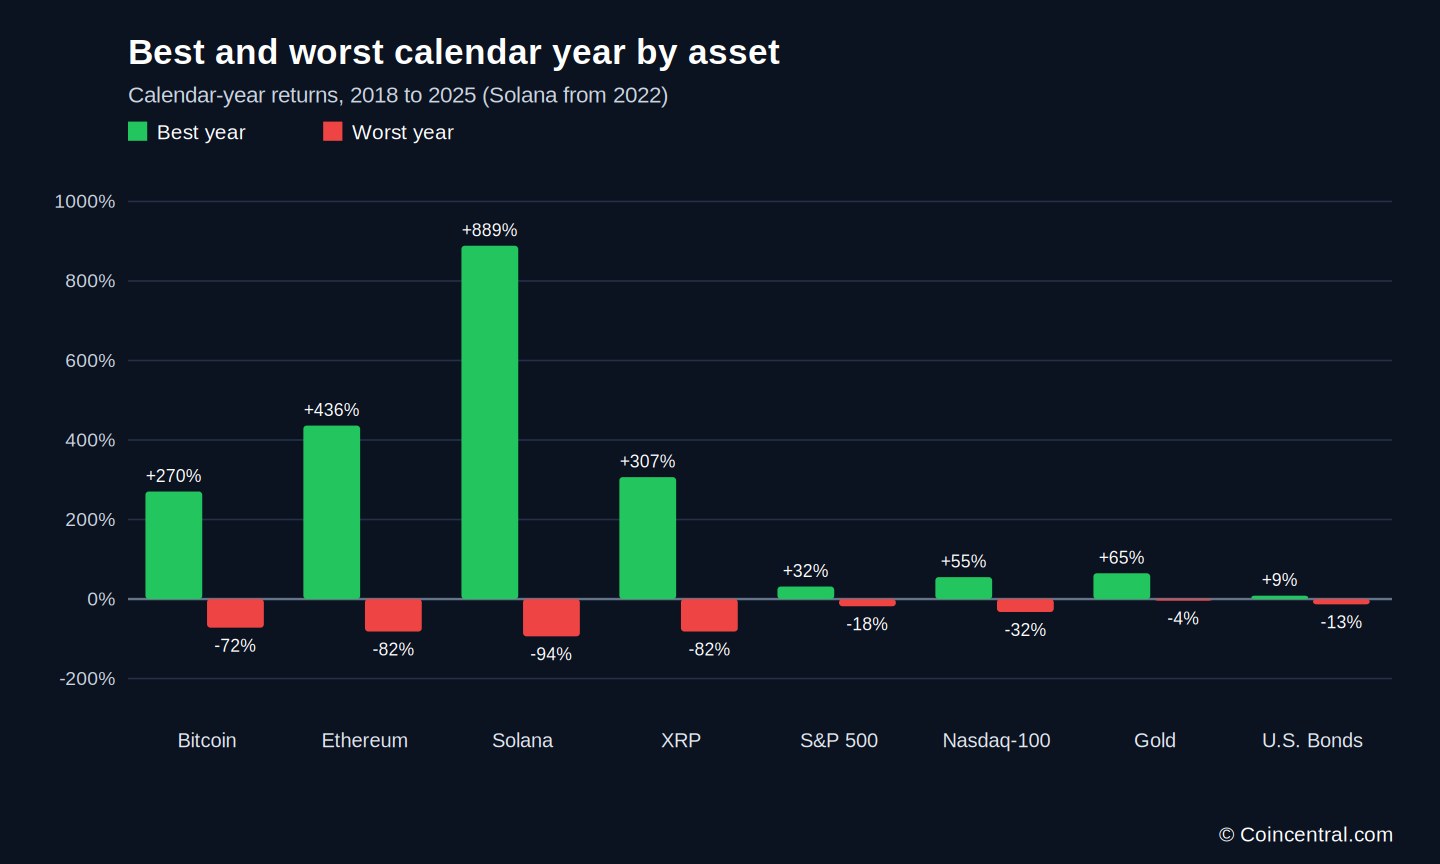
Cryptocurrency has produced some of the largest investment returns of the past decade — and some of the steepest losses. Bitcoin recorded several calendar years with gains above 100%, Ethereum more than quintupled in two separate years, Solana gained nearly 900% in 2023, and XRP climbed more than 250% in 2024.
The drawdowns were just as severe. Bitcoin lost more than 60% in both 2018 and 2022, Ethereum fell more than 80% in 2018, and Solana dropped more than 90% in 2022.
Traditional assets told a very different story. The S&P 500's worst calendar year between 2018 and 2025 was a loss of roughly 18% in 2022, gold finished that year almost flat, and U.S. bonds fell about 13%.
This report compares Bitcoin, Ethereum, Solana and XRP against the S&P 500, the Nasdaq-100, gold and U.S. bonds, using calendar-year returns wherever the data allows a fair comparison.
Crypto vs Traditional Assets: Annual Returns at a Glance
The figures illustrate the gap between crypto returns and those available in conventional markets. Each number represents a calendar-year return.
The 2018–2025 window used throughout the report spans two full crypto bear markets and two major bull runs, which is what makes the year-by-year comparison across asset classes meaningful rather than a snapshot of a single phase of the market.
U.S. bonds are represented by the iShares Core U.S. Aggregate Bond ETF and the Bloomberg U.S. Aggregate Bond benchmark, while crypto figures come from Curvo historical datasets. Exact returns can differ slightly between providers because of closing times, exchange prices and methodology.
The main point is easy to see: crypto magnifies both gains and losses. Traditional markets rarely return several hundred percent in a year — but they also rarely lose 60% to 90% in a single year.
Bitcoin Returns by Year
Bitcoin has delivered the strongest long-term performance among the major liquid assets covered here, although its returns have become less extreme as the market has matured.
Bitcoin fell about 72% in 2018 as the 2017 bubble unwound, rebounded almost 98% in 2019 and gained roughly 270% in 2020, a year of growing institutional interest and very loose global monetary conditions. It added another 73% in 2021 before another crypto winter arrived.
In 2022, tighter monetary policy coincided with a cascade of industry failures: Terra/Luna, Three Arrows Capital, Celsius and eventually FTX all collapsed. Bitcoin lost about 62% that year — a reminder of how closely crypto can track wider market stress. Stocks and bonds also fell, though by much smaller amounts.
The reversal was sharp. Bitcoin returned about 147% in 2023 and 135% in 2024 in the Curvo series, a year in which U.S. spot Bitcoin ETFs launched and the fourth halving took place.
Different datasets produce slightly different yearly figures, because crypto trades 24 hours a day and there is no single official closing price.
Bitcoin weakened in 2025. According to CoinGlass, it reached a record above $126,000 in October 2025 before reversing and ending the year down about 17%.
Even as a trillion-dollar institutional asset, Bitcoin has not behaved like a low-volatility store of value. It remains a high-beta investment capable of producing very large gains and very large draws.
Ethereum Returns by Year
Ethereum's yearly returns have been even more volatile than Bitcoin's. ETH fell about 81.5% in 2018 and was nearly flat in 2019 before surging in the 2020–2021 bull market, gaining about 423% in 2020 and about 436% in 2021.
A $10,000 ETH holding at the start of 2020 would have grown to well above $250,000 by the end of 2021, before trading costs or taxes. No major stock, bond or commodity index came close over the same period.
That volatility came at a cost. ETH fell about 65.5% in 2022, recovered about 86% in 2023 and 55% in 2024, then fell about 21.5% in 2025.
Curvo compared the two assets from August 2017 to July 2026: Bitcoin grew about 34% a year over that span, against about 20% for Ethereum. Ethereum's annualized standard deviation was about 95%, compared with 73% for Bitcoin. Ethereum has sometimes offered more upside than Bitcoin, but investors have paid for it with higher volatility.
Solana Shows the Extremes of Crypto Investing
Few assets illustrate crypto's extremes as clearly as Solana. SOL was one of the biggest losers of the 2022 bear market, with a calendar-year decline of about 93.8%. A $10,000 investment hit by a 93.8% loss would shrink to roughly $620, and getting back to even requires a huge gain.
Solana delivered one. SOL rose about 889% in 2023 and another 98% in 2024, before losing about 42% in 2025 in the Curvo series.
The mathematics of losses is uneven: a 50% loss requires a 100% gain to recover, and a 90% loss requires a 900% gain. Solana's near-900% return in 2023 was therefore large in absolute terms, but much of it was recovery from the year before.
Curvo puts Solana's standard deviation at more than 110% between late 2021 and 2026 — roughly twice Bitcoin's already elevated level over the same period.
XRP Returns by Year
XRP shows how sharply a single coin can diverge from Bitcoin. It fell about 82% in 2018 and another 44% in 2019, posted small returns of about 4% in 2020, then gained more than 300% in 2021 and lost about 57% in 2022. It rose about 77% in 2023, jumped about 259% in 2024 and fell about 22% in 2025 in the Curvo series.
These numbers explain why discussing “crypto returns” as one category can mislead. Bitcoin, Ethereum, Solana and XRP often move in the same direction, yet their yearly returns can differ by hundreds of percentage points. Investors who held only one coin could have had a very different outcome from those who held another — choosing the coin mattered as much as choosing to hold crypto at all.
Crypto vs the S&P 500
The contrast with U.S. stocks is stark. From 2018 to 2025, the S&P 500 returned -4.4%, 31.5%, 18.4%, 28.7%, -18.1%, 26.3%, 25.0% and 17.9%. These are total returns, so they include dividends. Dividends are also a source of return that the crypto assets in this comparison do not offer, since none of them pays one — a structural difference worth keeping in mind when the headline percentages are set side by side.
The S&P 500 had two negative years in the eight-year span; Bitcoin had three. But Bitcoin's positive years were far larger: in 2020, Bitcoin gained about 270% while the S&P 500 gained about 18%, and in 2023 Bitcoin rose about 147% against the index's 26%.
Stocks offered much lower upside in single years, but also steadier compounding. Equity investors rarely faced the kind of drawdown that would test their patience — and that steadiness is a large part of why stocks remain the foundation of many portfolios.
Bitcoin vs the Nasdaq-100
The Nasdaq-100 is a closer comparison, since tech stocks are also growth assets. The index returned about 0% in 2018, then 39.5%, 48.9% and 27.5% from 2019 to 2021. After a 32.4% loss in 2022, it gained 55.1% in 2023, 25.9% in 2024 and 21.0% in 2025.
According to Nasdaq, from the end of 2007 to the end of 2025 the Nasdaq-100 returned 1,342% in total, versus 560% for the S&P 500 — annualized, about 16% for the Nasdaq-100 against 11% for the S&P 500.
Even those gains look modest next to crypto bull markets. Ethereum's 423% gain in 2020 was more than eight times the Nasdaq-100's 48.9%, and Solana's 889% gain in 2023 was about 16 times the index's 55%.
The losses were smaller too. The Nasdaq-100's 32% drop in 2022 was roughly half of Bitcoin's and Ethereum's declines and about one-third of Solana's. Tech stocks carry real risk, as 2022 showed — crypto simply carried far more of it.
Crypto vs Gold
Gold has almost the opposite profile. Its yearly returns from 2018 to 2025 were about -1.6%, 18.3%, 24.8%, -3.7%, -0.4%, 12.8%, 27.0% and roughly 65%. The World Gold Council puts the 2025 gain at about 67% using the LBMA benchmark; small differences between price datasets explain the gap.
The council described 2025 as a record year by multi-decade standards, with gold setting 53 new PM benchmark highs during the year.
Over long periods, gold has returned far less than the top crypto assets, with far less volatility. The World Gold Council estimates gold has returned about 9% a year since 1971 — close to long-run stock returns and above bonds over the same period.
The two assets also behave differently. Crypto tends to do best when liquidity, risk appetite and speculative demand are strong while gold can perform well during financial stress, geopolitical tension and falling confidence in currencies or government debt. That is why investors often use them for different goals, even though both are sometimes described as alternatives to traditional money.
Crypto vs Bonds
Bonds offer an even bigger contrast. The iShares Core U.S. Aggregate Bond ETF, used here as a proxy for investment-grade U.S. bonds, returned -0.05%, 8.68%, 7.43%, -1.67%, -13.06%, 5.58%, 1.37% and 7.19% from 2018 to 2025.
BlackRock reports that the Bloomberg U.S. Aggregate Bond Index returned about 7.3% in 2025, with a ten-year annualized return of about 2.0% through December 2025.
The unusual year was 2022, when rapid interest rate increases by the Federal Reserve pushed bonds and stocks down together. That combination drew attention because bonds are normally relied on to move differently from stocks, and 2022 showed that this diversifying behavior depends on the interest-rate environment rather than holding automatically. The bond ETF lost about 13% — a large drop by bond standards, though crypto losses were far larger. Crypto sat at the far end of the risk spectrum.
What $10,000 Could Have Done
Percentage returns take on more meaning when converted into dollars. Consider $10,000 invested before a strong calendar year — and the reverse also applies: a 94% decline cuts $10,000 to about $600.
This is why the top return alone is a weak way to compare investments. The path matters as much as the result, and real investors also face trading costs and taxes, which lower these figures.
Compounding Changes the Picture
Looking across several years gives a more balanced view than picking out single bull markets. Compounding the yearly returns from 2018 through 2025 produces instructive — though illustrative — results, since real returns vary by data source, closing method, fees and investment vehicle.
Bitcoin still ranks first over the full period despite two large bear markets, while Ethereum ended slightly behind the Nasdaq-100 even after its huge gains in 2020 and 2021. The gap between crypto and traditional assets is much smaller than the best single years suggest.
The data also shows why avoiding huge losses matters. After a 90% decline, even a very large gain is mostly a recovery.
Crypto's Four-Year Cycle
Bitcoin's returns are often linked to its four-year halving cycle. A halving cuts the block reward paid to miners and occurs about every four years, and past halvings have lined up with major market cycles: the 2016 halving was followed by the 2017 bull market, the 2020 halving was followed by the 2020–2021 bull market, and the 2024 halving came with another major Bitcoin expansion. On that cadence, the next halving would be expected around 2028.
But halving cycles are not a guaranteed rule. Bitcoin is now shaped by factors that barely existed in earlier cycles, including:
- Spot Bitcoin ETFs
- Institutional asset managers
- Corporate Bitcoin treasuries
- Options and futures markets
- Global monetary policy
- Regulation
- Stablecoin liquidity
- Institutional arbitrage
According to CoinGlass, by 2025 Bitcoin increasingly acted like a high-beta, liquidity-sensitive risk asset that no longer moved apart from traditional financial conditions. Investors who rely only on the four-year pattern may miss the other forces that now move the market.
The Importance of Volatility
Return numbers alone can mislead; volatility shows how bumpy the ride was. Curvo estimates annualized volatility of about 73% for Bitcoin and 95% for Ethereum through 2026, while Solana's volatility exceeded 110% over a shorter period. Nasdaq reports volatility of about 22.9% for the Nasdaq-100 and 20.1% for the S&P 500 between the end of 2007 and 2025. The measurement periods differ by asset, so the comparison is a guide rather than an exact match.
Crypto investors have faced several times the annual volatility of stock investors. That helps explain how crypto can deliver far larger returns without being the right fit for every portfolio.
High volatility also affects behavior. Large swings can push investors to sell near a low or buy near a high, which can leave real results worse than the headline return.
2026 Returns So Far
The current year shows again how quickly leadership can change. Bitcoin entered 2026 after its record above $126,000 in October 2025 but struggled afterward; by October 11, 2026, it was down about 4% to 5% for the year, trading in the low $80,000 range.
The S&P 500 posted a total return of about 13.8% through October 2, including dividends.
Gold started 2026 strongly and briefly traded above $5,400 to $5,500 an ounce before reversing sharply; by September 30 it was down about 4.4% for the year in U.S. dollars, according to the World Gold Council. U.S. bonds also struggled as yields rose, with recent data for the iShares Core U.S. Aggregate Bond ETF showing a negative year-to-date return. With the October readings leaving roughly a quarter of the calendar unmeasured, the closing months of the year will determine where each asset's 2026 return finally ranks in the eight-year record above.
Last year's top asset is rarely guaranteed to lead the next year. Gold was a record performer in 2025 but was negative by late 2026, Bitcoin delivered huge returns in 2023 and 2024 before weakening, and U.S. stocks kept posting steadier gains.
Which Asset Has Produced the Best Returns?
The answer depends on the period measured. For maximum upside, crypto leads: no traditional asset in this comparison matches Ethereum's 436% in 2021, XRP's 307% in 2021, Solana's 889% in 2023 or Bitcoin's several triple-digit years.
For consistency, stocks look stronger. The S&P 500 delivered positive total returns in six of the eight years from 2018 to 2025 and never came close to an 80% to 90% yearly collapse. Gold returned less than the best crypto assets over the long run but offered diversification and posted a record 2025. Bonds returned the least, but they play a different role: their job is income, capital preservation and diversification, not maximum growth.
Time period matters a great deal. An investor who looked only at 2020 and 2021 would see crypto far ahead of everything else; an investor who only at 2022 would see the opposite.
The Bottom Line
Historical crypto returns are extraordinary. Bitcoin, Ethereum and leading altcoins have produced calendar-year gains that traditional markets almost never match — but those returns cannot be separated from risk. Bitcoin has repeatedly lost more than 60% in bear markets, Ethereum has fallen more than 80%, and Solana lost more than 90% in a single year.
Stocks sit in the middle. The S&P 500 and Nasdaq-100 have built wealth over the long term with much lower volatility and shallower drawdowns. Gold has offered lower but more defensive returns, while bonds have provided income and stability.
The main lesson is not that crypto performs better. It is that different assets earn their returns in different ways: crypto has offered the most upside and the most downside, stocks have delivered steadier compounding, gold has provided diversification and crisis protection, and bonds have provided stability and income.
For investors, the real question is not which asset had the best year, but how much volatility and drawdown they can accept in pursuit of higher long-term returns. Past returns do not predict future results, and each asset's yearly figures depend on the start date, the end date and the data source.
Sources
- Curvo: Bitcoin vs Ethereum historical performance — Annual BTC and ETH returns, cumulative performance, volatility and Sharpe-ratio comparisons through 2026.
- Curvo: Bitcoin vs Solana — Historical annual returns and volatility for Bitcoin and Solana.
- Curvo: XRP historical performance comparison — Annual XRP returns and long-term risk statistics.
- Slickcharts: S&P 500 total returns by year — Historical annual total returns including dividends.
- Nasdaq Global Indexes: Nasdaq-100 vs S&P 500 performance research — Annual returns and long-run comparison with the S&P 500.
- Nasdaq: 2025 Nasdaq-100 reconstitution and performance highlights — The index's 21% total return in 2025 and longer-term performance statistics.
- World Gold Council: Gold returns — Historical and current gold-return comparison tool.
- World Gold Council: Gold market commentary, December 2025 — Gold's record 2025 performance and year-end price.
- World Gold Council: Gold as a strategic asset 2026 — Long-term gold returns and comparisons with equities, bonds and commodities.
- World Gold Council: Gold market commentary, September 2026 — Current gold prices and 2026 year-to-date return through September.
- iShares: U.S. Aggregate Bond Index Fund prospectus — Calendar-year bond returns and Bloomberg U.S. Aggregate Bond Index performance.
- iShares: Core U.S. Aggregate Bond ETF — Historical calendar-year returns for the AGG bond-market proxy.
- CoinGlass: Bitcoin historical price data — Bitcoin historical prices, record highs and market-performance data.
- CoinGlass: 2025 crypto derivatives market annual report — Research on Bitcoin, ETH, SOL, institutional participation and Bitcoin's link to global liquidity.
- StatMuse: Historical gold returns — Calendar-year U.S. dollar gold-price return series through 2025.
- CoinCentral: Crypto Returns by Year Statistics: Bitcoin, Ethereum and Major Assets — Original source article.

