Crypto’s Q3 Rally Hid a Massive Revenue Slump
Key Takeaways
- •Bitcoin's NUPL improvement from 0.09 to 0.36 in Q3 appears largely to have resulted from the 43% price rally, which mechanically raises the metric without requiring substantial new capital.
- •Ethereum's rolling 12-month network fees fell 31% to $204 million, the report's only 'Negative' rating, as rollup adoption and a 45% drop in Layer-1 stablecoin settlements drained base-layer revenue.
- •Solana set records in transactions and address growth, with quarterly fees annualizing to roughly $224 million, but average SOL holdings remained about 7.4% below their aggregate cost basis, representing roughly $5.5 billion in unrealized losses.
- •Bitcoin miners captured approximately 22% more revenue than the previous halving cycle as a 9% year-over-year hash rate decline, driven by operators shifting capacity to AI workloads, pushed hash price up 25%.
- •Sub-cent fees on Ethereum and Solana mean large transfer volumes generate little protocol revenue, since token-holder value accrues indirectly through supply burns, staking yield, or mining incentives rather than direct distributions.
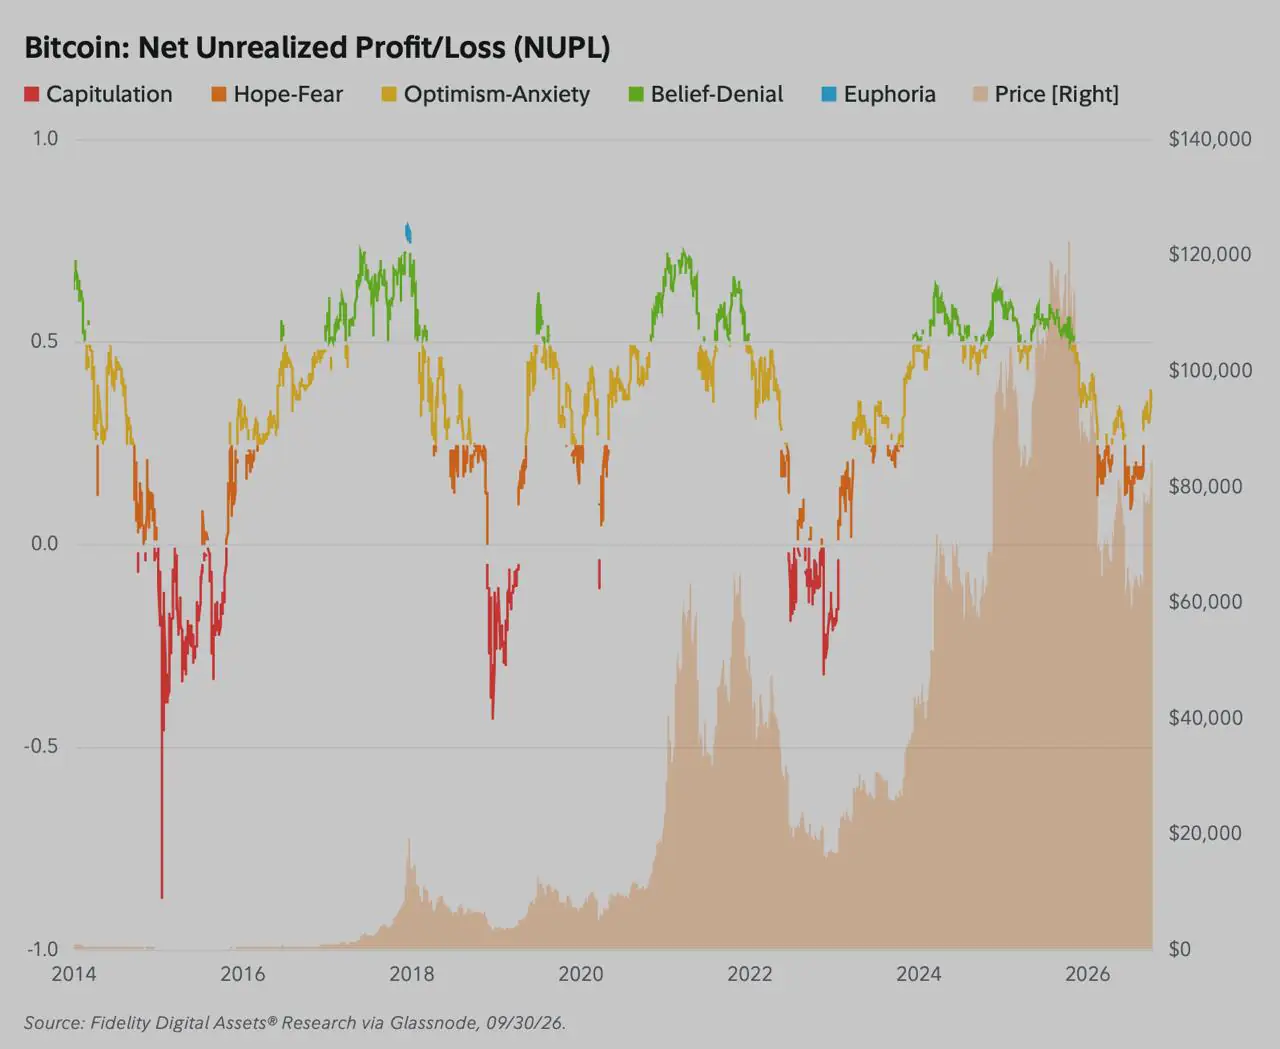
Onchain fee generation presented a fragmented picture beneath the crypto market's third-quarter rally. Ethereum's base-layer fee revenue fell to multi-quarter lows, Solana's surge in transaction activity produced limited protocol cash flow, and Bitcoin's profitability rebound largely reflected price appreciation rather than an influx of new capital.
The figures come from Fidelity Digital Assets' Q4 Signals Report, published October 28 using data through September 30. The series tracks fee generation, user activity, and holder profitability across major networks, giving readers a quarterly checkpoint on whether price gains are matched by onchain fundamentals.
Key figures
- Bitcoin rose 43% in Q3, while its NUPL increased from 0.09 to 0.36.
- Ethereum rose 71%, even as annual network fees declined 31%.
- Solana rose 61%, with its quarterly fee pace annualizing to approximately $224 million.
- Solana holders remained roughly 7.4% below their aggregate cost basis despite record throughput.
Bitcoin's profit recovery mostly reflected the rally
Fidelity's main profitability metric for Bitcoin is Net Unrealized Profit/Loss, or NUPL, which rose from 0.09 to 0.36 during the quarter. As formulated by Glassnode, NUPL divides the difference between market capitalization and realized capitalization by total market capitalization. Realized capitalization values each coin according to the price at which it last moved onchain, establishing an aggregate cost basis for the network.
A NUPL reading of 0.36 indicates that aggregate paper gains represented 36% of market value. It does not mean that 36% of active wallets or investors were in profit.
Because the prevailing spot price appears in both the numerator and denominator of the calculation, a market-wide rally can mechanically raise NUPL without requiring substantial new capital. At the beginning of Q3, a NUPL reading of 0.09 implied that the network's realized cost basis was approximately 91% of its market capitalization, or 1 − 0.09 = 0.91. Holding that aggregate cost basis unchanged and applying Bitcoin's 43% quarterly price increase produces the following sensitivity calculation:
1 − (0.91 ÷ 1.43) ≈ 0.36
Coindoo's sensitivity calculation using Fidelity's rounded inputs reaches Fidelity's reported endpoint. The calculation cannot track individual wallet turnover, but it indicates that the apparent improvement in Bitcoin's profitability was largely an arithmetic consequence of the rally.
The report also contains a data point that introduces a methodological discrepancy. Fidelity says Bitcoin traded 45% above its aggregate cost basis, which under the standard formula implies a NUPL closer to 0.31. A NUPL of 0.36 corresponds to Bitcoin trading approximately 56% above its cost basis. Regardless of the minor methodological differences, the broader conclusion remains that Bitcoin's profitability signal followed its price, while wider market participation remained muted.
Ethereum's value rose as its fees declined
Ether posted the strongest performance among the three assets, gaining 71% and moving its NUPL from deeply negative territory at −0.43 to positive territory at 0.16. The cash flow supporting the underlying protocol, however, deteriorated.
According to Fidelity's full report, rolling 12-month network fees fell 31%, from $294 million to $204 million. Fidelity assigned Ethereum's network fees a “Negative” rating, the only such designation in the report. Daily fees averaged $384,000 during the period, ranging from $133,000 to $1.5 million.
Mainnet usage contracted alongside revenue. Ethereum's 30-day average transaction count declined 10%, falling below two million transactions per day, while total active addresses decreased 6%. Economically relevant addresses increased 30%, indicating that retail activity had moved away from the base layer even as higher-value institutional settlement continued.
Fidelity said the substantial expansion in base-layer blockspace over the trailing year had not yet generated a proportional increase in economic demand. The pending Glamsterdam upgrade, which is slated to expand throughput further, would add capacity to an already oversupplied mainnet execution market.
This separation between activity and base-layer revenue is linked to Ethereum's modular scaling architecture. Modern rollups execute transactions off-chain and post compressed data batches to Layer 1, reducing user costs while also diverting fee revenue from the base layer. Ethereum's scaling documentation describes the role of rollups in this architecture.
For ETH holders, the shift creates economic trade-offs. Lower base fees reduce the amount of ETH permanently removed from circulation under EIP-1559, making the asset net-inflationary during the quarter. The revenue decline also reduces the economic component of staking returns, leaving validator yields closer to issuance rewards when priority tips are limited.
Stablecoin activity reflected the migration away from Layer 1. Average daily stablecoin settlements on Ethereum fell to $37 billion during the final 30 days of the quarter, a 45% decline from the $67 billion daily average recorded during the first month as activity continued moving toward cheaper execution environments.
Solana's fees improved before the trailing data reflected it
Solana showed the clearest evidence of operational expansion. Monthly transactions increased 23% to record levels, active addresses grew 53%, new addresses rose 50%, and economically relevant addresses increased 58%.
Low-fee blockchains are particularly exposed to automated wallet spam, a measurement distortion highlighted by Coin Metrics in its address methodology. Even so, the 58% increase in economically relevant addresses pointed to user growth beyond simple network noise.
Solana's trailing revenue figure obscured the quarterly acceleration. Trailing 12-month fees declined 13% to $193 million, primarily because the rolling period dropped earlier high-activity data as newer figures entered the calculation. On a quarterly basis, daily fee capture averaged $922,000, equivalent to an annualized run rate of approximately $224 million.
That quarterly pace exceeded the trailing-year figure, leading Fidelity to conclude that Solana's prolonged fee decline was beginning to establish a durable floor.
Stablecoin activity also accelerated. Solana processed more than $10 billion per day in stablecoin transfers, up 20% from the second quarter. The gap between Solana and Ethereum narrowed to $26 billion, down from nearly $60 billion earlier in the year. Solana's native stablecoin supply increased 9% to $1.37 billion, far exceeding the broader stablecoin market's 0.5% growth.
The operational expansion had not fully repaired token-holder balance sheets. Solana's NUPL improved from −0.73 to −0.08, but the average SOL token still remained approximately 7.4% below its aggregate cost basis. That represented about $5.5 billion in unrealized losses across the network.
Raw throughput therefore outpaced capital recovery. The comparison between Solana's user counts and Ethereum's financial depth remains relevant: processing high volumes of transactions does not automatically translate into institutional balance-sheet value.
Moving money does not necessarily generate protocol revenue
Aggregate transfer volumes measure how much capital is moving, not how effectively a protocol captures revenue from that movement. Fidelity said estimated stablecoin transfer fees on Ethereum remained below $1 for four consecutive quarters, while Solana's median transaction fee consistently stayed below one-tenth of a cent.
Under those conditions, billions of dollars in liquidity can move across either network with little effect on protocol earnings. The amount of economic activity that ultimately accrues to token holders depends on each network's fee-capture design:
- Bitcoin: Transaction fees go directly to miners in addition to programmatic block subsidies. They function as an operational incentive rather than a direct token-accrual mechanism, as described in the Bitcoin developer guide.
- Ethereum: The base fee is permanently burned, reducing the circulating supply of ETH, while priority tips compensate block-proposing validators. The mechanism is described in Ethereum's gas documentation.
- Solana: Fifty percent of the base fee is burned and the remaining half goes to validators, while priority fees pass entirely to block producers, according to Solana's documentation.
Across all three networks, onchain activity reaches token holders indirectly through mining security, validator staking yield, or supply reduction rather than through direct, dividend-like equity distributions. When transaction fees decline or remain at sub-cent levels, those value-accrual channels become limited.
Bitcoin miners benefited from a different factor
Bitcoin's long-term use case has generally focused on holding rather than high-frequency transactional throughput, so weak fee generation has different implications for the asset than it does for a platform whose economics depend on application activity.
The latest mining data showed how operator revenue can increase even while onchain fee generation stagnates. Instead of relying on users spending more satoshis on transactions, miners benefited from a reduction in competing compute capacity.
After Bitcoin's correction from its late-2025 peak, several major mining operators redirected power infrastructure and high-performance computing assets from SHA-256 hashing toward hosting artificial-intelligence workloads. Network hash rate consequently declined 9% year over year.
As competitive pressure eased, hash price—the expected revenue generated per unit of computing power—increased 25%. Miners captured approximately 22% more revenue than during the previous halving cycle despite operating under a block subsidy that was twice as large. The improvement in miner margins resulted from reduced domestic competition rather than organic growth in transaction demand.
Three networks, three different profiles
The third quarter delivered similar price tailwinds to Bitcoin, Ether, and Solana's token, but it also revealed three distinct fundamental profiles.
Bitcoin's increase in paper profitability closely mirrored its price action, while its mining economy benefited from a shift toward artificial-intelligence compute rather than stronger demand for blockspace. Ethereum's market capitalization expanded even as annual base-layer fee revenue fell 31% to $204 million amid the migration of activity to rollups. Solana established an annualized fee run rate of approximately $224 million alongside record user throughput, yet its persistent sub-cent fee model left token holders more than 7% below their aggregate cost basis.
Because the dataset runs only through September 30, Fidelity's next Signals report will offer the first check on whether Solana's quarterly fee floor holds, whether Ethereum's rolling fee decline steadies, and whether Bitcoin's profitability continues to track price more closely than network usage.
This article is provided for informational purposes only and does not constitute financial or investment advice.

