2026 Week 33 Crypto Market Watch: ETF Outflows and Exchange Deposits Pressure Bitcoin as Ether and LINK Outperform
Key Takeaways
- •Total crypto market capitalization fell about 2.7% to roughly $2.14 trillion during August 10-16, 2026, with Bitcoin declining 3.12% to $62,818.65 and Ether dropping 1.82% to $1,873.94.
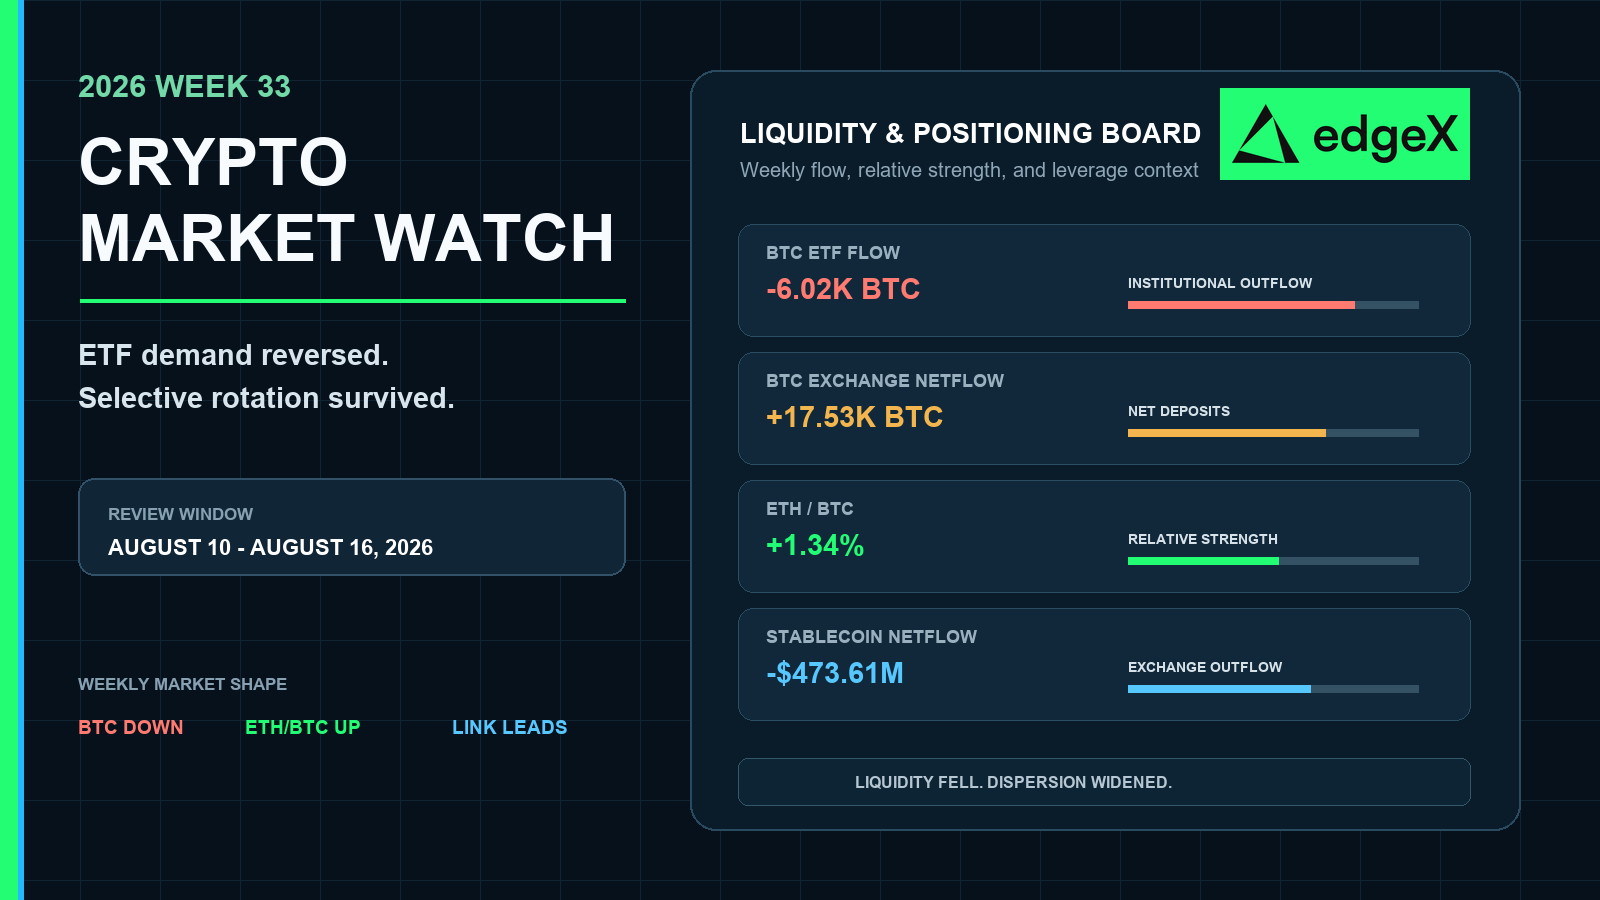
- •U.S. spot Bitcoin ETFs recorded net outflows of about 6,020 BTC, an estimated $389.71 million and the heaviest weekly loss since early July, while Ether ETF flows ended nearly balanced at roughly -1.49K ETH.
- •Bitcoin exchange netflow was positive on all seven days, totaling +17,526 BTC and increasing readily tradable supply, even as the 30-day demand-growth measure turned positive for the first time since February.
- •Combined USDT and USDC circulating supply contracted by $426.83 million and stablecoin exchange netflow finished near -$473.61 million, reducing the dollar-liquidity cushion available to absorb selling.
- •Altcoin performance was sharply dispersed, as LINK gained 14.74%, HYPE rose 6.12% and XMR advanced 3.83%, while ADA fell 10.18% and BCH lost 5.06%, reflecting selective rotation rather than a broad altcoin rally.
Quick Answer
Crypto weakened in Week 33 as Bitcoin ETF demand reversed, BTC moved onto exchanges and dollar liquidity contracted. Total market value fell about 2.7%, yet the decline did not produce uniform risk reduction. Ether outperformed Bitcoin, ETH ETF flows nearly balanced, and LINK, HYPE and XMR advanced against a falling market. Bitcoin's broader 30-day demand-growth measure had recently returned to positive territory, but that improvement was not strong enough to absorb persistent exchange deposits and roughly 6.02K BTC of ETF outflows. The result was a market with weaker aggregate liquidity, selective altcoin leadership and substantial leverage positioned on both sides of current prices.
Crypto Lost Ground as Institutional Demand Reversed
Week 33 erased much of the previous week's recovery. TradingView's TOTAL measure ended August 9 near $2.20 trillion, while an August 17 market update placed Monday's market value near $2.16 trillion after a 0.88% rise from Sunday's close. That implies an August 16 close of approximately $2.14 trillion, down about 2.7% for the review window. The same update identified $2.18 trillion as the level lost during the week and $2.12 trillion as the floor that had held since August 1.
The retreat was visible in both leading assets. CoinMarketCap's August 16 historical snapshot priced Bitcoin at $62,818.65, a seven-day decline of 3.12%, and Ether at $1,873.94, down 1.82%. Bitcoin's market capitalization fell by roughly $40.46 billion to $1.261 trillion, while Ether's declined by about $4.19 billion to $226.15 billion.
Bitcoin therefore accounted for most of the loss among the two largest non-stablecoin assets. Using the Week 32 TradingView dominance close of 59.39% and the Week 33 market-cap readings, Bitcoin's approximate share of the market eased toward 58.9%. That calculation is a cross-source estimate rather than a direct daily BTC.D print, but it fits the week's relative-performance pattern: Bitcoin fell more than Ether and several large altcoins gained.
Global equity funds reportedly attracted $18.62 billion in the week to August 12, their twelfth consecutive week of inflows, while crypto market value declined. Risk appetite persisted outside digital assets, leaving the reversal in U.S. spot Bitcoin ETF demand as the clearest crypto-specific drag.
Week 33 Crypto Dashboard
| Signal | Week 33 Reading | Market Interpretation |
| Total crypto market cap | About $2.20T to $2.14T (-2.7%) | The market lost the prior week's expansion and closed near support |
| Bitcoin | $62,818.65 (-3.12%) | BTC underperformed Ether and drove much of the large-cap loss |
| Ether | $1,873.94 (-1.82%) | ETH declined, but held relative strength against BTC |
| ETH/BTC | 0.02943 to 0.02983 (+1.34%) | Ether regained ground without establishing a broad altcoin cycle |
| BTC exchange netflow | +17,526 BTC | Persistent net deposits increased readily tradable supply |
| U.S. spot Bitcoin ETF flow | -6,019.96 BTC | Four of five sessions were negative |
| U.S. spot Ether ETF flow | About -1.49K ETH | Midweek inflows nearly repaired Monday's outflow |
| Stablecoin exchange netflow | About -$473.61M | Net withdrawals reduced exchange-based dollar liquidity |
| Combined USDT and USDC supply | -$426.83M | The two largest stablecoins contracted together |
Aggregate value, Bitcoin and stablecoin liquidity weakened together, but Ether held up better and selected altcoins rallied. Capital rotated inside a shrinking market instead of leaving every sector at the same speed.
Bitcoin Demand Improved, but Supply Reached Exchanges
Bitcoin's on-chain picture contained two opposing forces. CryptoQuant's 30-day demand-growth measure, combining spot and perpetual-futures activity, had recently recovered to approximately +25,000 BTC around Week 33. It was the first positive reading since February after a severe contraction that reached roughly -650,050 BTC in early June. The turnaround showed that demand was no longer shrinking at the earlier pace, but +25,000 BTC remained modest relative to the size of the preceding contraction.
Exchange deposits stayed positive throughout the week
Exchange netflow was positive on all seven days. Daily net deposits reached 3,748.61 BTC on August 10, peaked at 4,228.79 BTC on August 11 and remained above 2,300 BTC through August 14. The full-week balance was +17,526.07 BTC, or an average of approximately 2,503.72 BTC per day.
Deposits do not prove that holders sold. Coins can move to exchanges for collateral, custody, market-making or internal transfers. A week of uninterrupted positive netflow still increased the amount of BTC readily available for trading while price and ETF demand weakened. The direction contrasted with the midweek withdrawals that had supported Week 32's recovery.
Net deposits slowed to 683.18 BTC on August 15 and only 105.39 BTC on August 16. That deceleration reduced immediate supply pressure into the close, but it did not reverse the weekly total. A move back to sustained withdrawals would provide stronger confirmation that exchange-side supply is tightening.
Whale-retail dispersion recovered late
CryptoQuant's Whale vs. Retail Delta stayed positive throughout Week 33 and averaged approximately 0.325. It fell from a weekly high of 0.434 on August 10 to a low of 0.201 on August 13, then recovered to 0.407 by August 16. The indicator measures a relative gap between cohorts; it does not demonstrate that whales bought while retail sold.
The late rebound nevertheless showed that the cohort difference widened again as exchange deposits faded. Combined with positive 30-day demand growth, it kept the week from becoming a one-directional distribution signal. The stronger confirmation would be a positive demand reading accompanied by negative exchange netflow and improving spot ETF flows.
Ether Outperformed as ETF Flows Nearly Balanced
Ether's dollar price fell, but its relative performance improved. ETH/BTC rose from approximately 0.02943 on August 9 to 0.02983 on August 16, a gain of about 1.34%. That move was consistent with Ether's smaller weekly decline and the estimated drop in Bitcoin's market share.
The ETF comparison reinforced the divergence. CoinGlass native-unit data showed Bitcoin ETFs losing 2,229.15 BTC on August 10, adding only 121.99 BTC on August 11, then posting three more negative sessions. The five-day balance reached -6,019.96 BTC. A separate dollar-based market update estimated a $389.71 million weekly Bitcoin ETF outflow, the heaviest since early July, after approximately $853.54 million of inflows in the prior week.
Ether ETF flows began with an outflow of roughly 7.65K ETH on August 10. The next three reported sessions recovered most of it: August 12 added about 3.93K ETH and August 13 added roughly 3.14K ETH, while August 14 showed no reported flow across the products in the supplied snapshot. The weekly balance was approximately -1.49K ETH.
Near-balanced ETF flow did not make Ether bullish in absolute terms; it still ended below $1,900. It did mean the regulated-wrapper demand shock was concentrated in Bitcoin. A sustained ETH/BTC break above 0.030 would strengthen the case for broader relative leadership, while renewed Ether ETF outflows would weaken it.
Altcoin Breadth Stayed Selective
CoinMarketCap's August 16 snapshot showed unusually wide dispersion among large-cap assets. LINK gained 14.74%, HYPE rose 6.12% and XMR advanced 3.83%. BNB, TRX and DOGE finished slightly positive. Their resilience helped explain why estimated Bitcoin dominance eased despite a falling total market.
The losing side was equally important. ADA dropped 10.18%, BCH fell 5.06%, ZEC lost 4.71%, LEO declined 4.05%, XRP fell 3.59% and XLM lost 3.67%. SOL declined 2.20%, close to the broad-market move but still less than Bitcoin.
| Asset | Seven-Day Move | Week 33 Breadth Role |
| LINK | +14.74% | Strongest top-20 advance and clear idiosyncratic leadership |
| HYPE | +6.12% | Continued relative strength in on-chain derivatives exposure |
| XMR | +3.83% | Defensive relative winner in a falling market |
| BNB | +0.12% | Held flat while the market contracted |
| SOL | -2.20% | Declined, but outperformed Bitcoin |
| XRP | -3.59% | Large-cap payments exposure remained weak |
| BCH | -5.06% | Underperformed both BTC and the total market |
| ADA | -10.18% | Sharpest decline among the displayed top-20 assets |
The spread between LINK and ADA exceeded 24 percentage points. That is rotation, not synchronized altseason. The market rewarded a small set of narratives while withdrawing capital from others, leaving index-level weakness alongside strong single-asset momentum. Broad confirmation would require more large-cap assets to outperform Bitcoin while total market capitalization rises rather than falls.
Stablecoin Liquidity Contracted Despite a Transparency Milestone
Stablecoin data supplied the clearest liquidity warning. CoinMarketCap snapshots show combined circulating supply of USDT and USDC falling from approximately $255.47 billion on August 9 to $255.04 billion on August 16, a contraction of $426.83 million. USDT supply declined by about $91.21 million, while USDC fell by roughly $335.62 million.
CryptoQuant's all-stablecoin exchange netflow also finished negative. Net outflow reached $691.25 million on August 10 and $202.13 million on August 13, partly offset by a $412.36 million inflow on August 14. The seven-day balance was approximately -$473.61 million. Because netflow equals inflow minus outflow, a negative reading indicates that more stablecoin value left exchange wallets than entered them.
Falling circulating supply and negative exchange netflow are separate mechanisms. The first points to contraction in the two largest stablecoin bases; the second points to fewer stablecoins held on exchanges. Together they reduced the immediate dollar-liquidity cushion available to absorb risk-asset selling.
The sector also recorded a major governance development. On August 13, Tether announced that KPMG U.S. had issued an unqualified audit opinion on Tether International's 2025 financial statements. Tether said the audited statements showed reserves exceeding liabilities by $6.814 billion. The opinion strengthens the issuer's transparency framework, but it describes the 2025 financial statements and does not change Week 33's negative supply and exchange-flow readings.
Derivatives Left Both Sides Vulnerable
Bitcoin derivatives did not show a clean leverage washout. MacroMicro's dated open-interest series rose from approximately $22.66 billion on August 10 to $22.96 billion on August 16, an increase of about 1.3%, while Bitcoin's spot price declined. Open interest can rise because of new longs, new shorts or hedges, so the increase is evidence of added positioning rather than a directional bet. The same source placed the August 16 Bitcoin perpetual-futures funding rate at a modestly positive 0.0049%, indicating that long positioning still paid shorts at the snapshot.
CoinGlass 30-day liquidation maps viewed on August 19 are publication-time risk context, not Week 33 performance data. The BTC map displayed a current price of $64,326. The nearest major long-liquidation concentration sat around $62,000-$62,600, with a secondary lower band near $61,400-$61,900. Short-liquidation exposure was concentrated around $65,500-$66,100, followed by $67,100-$67,700.
ETH's map displayed $1,912.80. The densest lower cluster appeared around $1,840-$1,865, especially $1,850-$1,860, with another band at $1,800-$1,830. The main upper cluster sat near $1,935-$1,960, followed by $1,980-$2,000.
These zones are estimates of where leveraged positions may be forced to close, not forecasts or guaranteed support and resistance. BTC and ETH were positioned between meaningful two-sided concentrations. A break in either direction could therefore accelerate through forced liquidations even without a new fundamental catalyst.
Week 34 Must Confirm Whether Rotation Can Become Recovery
The constructive path begins with total market capitalization reclaiming $2.18 trillion and holding above it. Bitcoin ETF flows would need to turn positive, while exchange netflow would need to shift from deposits toward withdrawals. ETH/BTC sustaining above 0.030 and more large-cap assets joining LINK and HYPE would indicate that rotation is broadening rather than hiding weakness in the aggregate market.
Stablecoin conditions are the second test. Expansion in combined USDT and USDC supply, accompanied by positive stablecoin exchange netflow, would restore part of the liquidity buffer lost in Week 33. Continued contraction would leave rallies more dependent on leverage and asset-to-asset rotation.
The weaker path begins with a loss of the $2.12 trillion total-market floor identified in the August 17 TradingView-based analysis. BTC moving through the $62,000-$62,600 liquidation band and ETH losing $1,840 would raise the risk of forced selling. Rising open interest during that move would increase the market's sensitivity to another leverage cascade.
Week 33 did not eliminate demand. Bitcoin's 30-day demand-growth measure was positive, Ether's ETF flows nearly balanced, and several altcoins produced strong returns. Those pockets of resilience were outweighed by Bitcoin ETF withdrawals, persistent BTC exchange deposits and contracting stablecoin liquidity. Recovery requires those three aggregate pressures to reverse, not merely another isolated token rally.
Trade Crypto With Leverage - Without Giving Up Custody
Decentralized perpetual exchanges have moved well past niche status. According to CoinGecko's 2025 Annual Crypto Report, DEX perpetual trading volume surged 346% last year, reaching $6.7 trillion, while centralized exchange open interest fell 20.8% over the same period. Traders are committing serious capital to on-chain derivatives, and the reasons are straightforward: counterparty risk is real, custodial failures happen, and censorship resistance matters.
edgeX is a decentralized perpetual futures exchange built for traders who want market access without sacrificing control. Here's what sets it apart:
- No KYC, no barriers. Connect a wallet and start trading. No identity verification or account approvals are required.
- True self-custody. edgeX combines off-chain order matching with verifiable on-chain settlement secured by Ethereum. Forced-withdrawal mechanisms keep funds recoverable directly from the blockchain even if the operator goes offline.
- Deep liquidity, tight spreads. edgeX maintains $10 million of market depth within a one-basis-point spread, with sub-0.1-basis-point slippage on trades exceeding $100,000.
- Up to 100x leverage. Traders can scale positions to match their risk framework, whether hedging exposure or trading momentum.
- 140% trading fee rewards. Active traders can earn rewards on their trading activity, reducing the net cost of frequent strategies.
- Institutional-grade infrastructure. edgeX processes up to 200,000 orders per second with matching latency below 10 milliseconds.
Start trading crypto perpetual futures on edgeX and put your market view to work.
Frequently Asked Questions
What dates does the Week 33 Crypto Market Watch cover?
The review covers August 10-16, 2026, using UTC boundaries. The CoinGlass liquidation maps were viewed on August 19 and are used only as forward-looking positioning context.
Why did crypto fall in Week 33?
Total market value fell as Bitcoin ETFs recorded roughly 6.02K BTC of net outflows, BTC exchange netflow remained positive every day, and combined USDT-USDC circulating supply contracted. Those pressures outweighed improving 30-day Bitcoin demand growth and selective altcoin strength.
Did Ether outperform Bitcoin?
Yes. Ether fell 1.82% while Bitcoin declined 3.12%, lifting ETH/BTC by approximately 1.34%. Ether ETF flows were also much closer to balanced than Bitcoin ETF flows.
What did Bitcoin exchange netflow show?
CryptoQuant netflow totaled approximately +17,526 BTC. Positive netflow means deposits exceeded withdrawals, increasing readily tradable exchange supply, although it does not prove that deposited coins were sold.
Was Week 33 an altcoin rally?
No. LINK, HYPE and XMR gained, but ADA, BCH, ZEC, XRP and XLM declined. The dispersion was selective rotation inside a shrinking total market rather than a synchronized altcoin advance.
Which liquidation levels matter after Week 33?
The August 19 CoinGlass maps showed BTC clusters at $62,000-$62,600 below and $65,500-$66,100 above. ETH clusters appeared at $1,840-$1,865 below and $1,935-$1,960 above. These are estimated leverage concentrations, not price targets.

