Crypto Market Cap Statistics: The Numbers Defining a $2.99 Trillion Market
Key Takeaways
- •Bitcoin, Ethereum and Tether together represented roughly 76% of the $2.99 trillion crypto market at the end of 2025.
- •Bitcoin dominance generally ranged from 55% to 59% through 2026, while stablecoins accounted for about 13% to 14% of total market capitalization.
- •Fully diluted valuation can substantially exceed market cap when many tokens remain locked or unreleased, making supply schedules important for comparisons.
- •Dogecoin creates about 5.3 billion new coins annually without a supply cap, while Bitcoin’s issuance is about 164,000 coins per year under a 21 million limit.
- •Market capitalization does not measure money invested, project quality or future returns, particularly in volatile or illiquid markets.
Market capitalization is one of the first figures traders and researchers check when evaluating a cryptocurrency. Calculated by multiplying a coin's price by the number of coins in circulation, it offers a quick estimate of a project's total value.
This report compiles the core statistics on crypto market cap: how the metric is built, how large the market has become, how the biggest coins compare, and where the number falls short. All figures come from the sources listed at the end of this article, and dates are attached throughout because crypto prices move frequently.
How Crypto Market Cap Is Calculated
The formula is a single equation: current price multiplied by circulating supply. A token trading at $10 with 10 million tokens in circulation carries a market cap of $100 million.
Circulating supply counts only the coins available to the public. It excludes tokens locked in smart contracts, tokens held by project teams for later release, and coins removed through token burns. Data platforms typically average a coin's price across several exchanges, which reduces gaps between individual trading venues.
Most major data platforms rank assets by this number, making it easy to compare hundreds of tokens at a glance even though the projects behind them differ in purpose and design. Coursera describes the global crypto market cap as the sum of all individual coin market caps; because prices can swing quickly, the total can change by large amounts in a short time.
Why Market Cap Matters More Than Price
Investors use market cap in several practical ways: comparing projects by size, shaping portfolio choices and building indexes. A $5 billion project is generally seen as larger and more established than a $500 million one, though that says nothing about future returns.
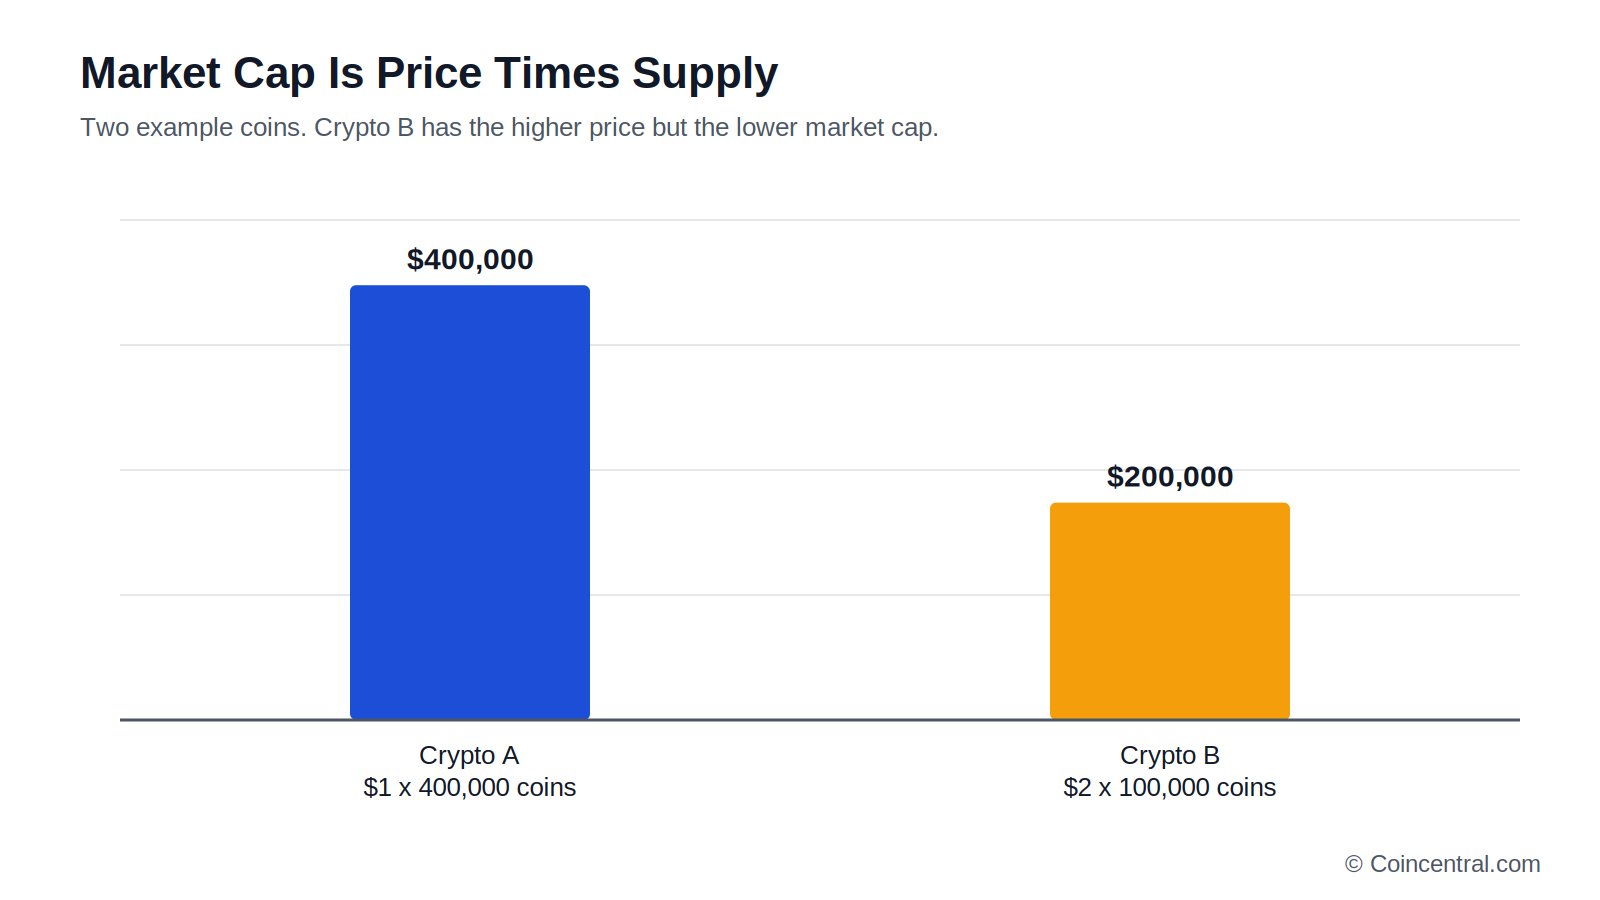
Price alone does not show the size of a project. Cryptocurrency A has 400,000 coins at $1 each, giving it a $400,000 market cap. Cryptocurrency B has 100,000 coins at $2 each, for a $200,000 market cap. Coin B carries the higher price, yet Coin A is worth twice as much in total — which is why market cap, not price per coin, is used to compare projects.
A low price can mislead as well. A token priced at $0.10 with 100 billion coins in circulation has a market cap of $10 billion.
Total Crypto Market Cap Over Time
The total crypto market cap adds up the value of every crypto project in circulation and serves as a broad measure of the size of the entire market.
Coursera reported the total at $2.99 trillion on December 31, 2025 — just under the first $3 trillion peak reached in early November 2021. The market had already passed that level in the interim: in December 2024 the total reached $3.96 trillion, which means the end-of-2025 figure was about $970 billion lower. It took roughly three years for the market to move clearly above its 2021 level, and the path from 2021 to 2024 shows how long a recovery can take.
Changes in the total are often read as a signal of sentiment. Cryptopedia says a rising total market cap tends to accompany positive sentiment, and a falling one negative sentiment. Tracking the total also helps investors spot bull and bear market cycles: small-cap coins often do better in bull markets, while large-cap coins tend to hold value better in downturns.
The drop from the December 2024 level shows that the total can fall as well as rise. A market near $4 trillion lost about a quarter of its value between those two readings, and the path between the dates may have been uneven, since each figure is a single snapshot. Those snapshots give readers fixed reference points for judging where the total stands in any later reading.
Grand View Research projects growth of 14.5% a year from 2026 to 2033. Coursera states the 2033 figure as $18.26 billion, far below today's total — a discrepancy that suggests the report covers a narrower part of the industry, so readers should check the original report before using the number.
The Largest Coins by Market Cap
On December 31, 2025, Bitcoin had a price of $87,455 and a market cap of $1.74 trillion. Ethereum ranked second with a market cap of $357 billion and a price of $2,931. Tether (USDT) ranked third at $186 billion; the stable-value coin, built to track the US dollar, traded at $0.99.
Bitcoin alone made up about 58% of the $2.99 trillion total. Ethereum accounted for about 12% and Tether about 6%, meaning the top three held roughly 76% of the market.
Earlier data shows how these values move. In March 2024, one source listed Bitcoin at about $1.3 trillion and Ethereum at $390 billion. By the end of 2025, Bitcoin was about 34% higher and Ethereum about 8% lower, though the two dates are far apart and the comparison is rough.
More recent figures from October 9, 2026, put Bitcoin's market cap at about $1.65 trillion, with a price of $82,462. Even the largest coin sees price swings: Bitcoin's price moved from $87,455 at the end of 2025 to $82,462 in October 2026, a drop of about 6%.
Tether's place on the list shows that market cap does not always follow price. Because the coin is built to stay near $1, its market cap tends to change mostly when the number of coins in circulation changes.
Large market caps tend to go with more stability. Coursera compares this to a big ship that handles heavy weather better than a small boat, while stressing that even Bitcoin still sees volatility.
Market Cap Tiers: Large, Mid and Small
Crypto assets are often grouped into tiers by market cap. The tiers are not formally set and thresholds differ across data platforms, but the most common split is large-cap above $10 billion, mid-cap from $1 billion to $10 billion, and small-cap below $1 billion.
Large-cap coins are linked with higher liquidity and longer track records. Cryptopedia lists Bitcoin, Ethereum and BNB in this group. Mid-cap coins are seen as a balance between growth potential and higher risk, with Solana, Polkadot and Chainlink as examples. Small-cap coins include newer altcoins, niche projects and meme tokens such as Shiba Inu.
Market cap also feeds crypto indexes. CoinMarketCap offers curated indices such as the CoinMarketCap 20 Index, and some investment products aim to track the highest market cap coins as a stand-in for the wider market.
Coursera compares market cap to a stack of paper: one sheet tears easily, while a thick stack is hard to rip. In the same way, a larger market cap can make a coin harder to move with a few trades. Coursera also notes that market cap does not measure risk on its own — crypto is volatile across all tiers, so the tier is one factor among several. Cryptopedia says lower-risk investors tend to prefer large-cap coins, while risk-tolerant traders look at smaller assets for higher potential returns. A balanced plan may mix large-cap and mid-cap coins.
Bitcoin Dominance and Stablecoin Share
Bitcoin dominance measures Bitcoin's share of the total crypto market cap and is widely followed as a sign of market mood and of where money is flowing.
Through 2026, Bitcoin dominance generally sat in the mid-to-high 50% range, while stablecoins made up roughly 13% to 14% of the total. Put together, Bitcoin and stablecoins account for roughly 68% to 73% of the market, leaving about 27% to 32% for Ethereum and every other asset.
Because stablecoins are built to hold a steady value, their share reflects how much money sits in dollar-linked coins. A share of 13% to 14% means about one dollar in every seven or eight of total market cap is held in stablecoins. The ranges are used here because the source gives general levels rather than exact daily readings; the mid-to-high 50s is shown as 55% to 59%.
Dominance can help show how capital is spread. A rising Bitcoin share can mean investors are moving toward the largest coin, while a falling share can mean interest is spreading to other assets. For readers following these figures, the levels reported for 2026 provide a baseline against which later readings can be measured.
Circulating Supply vs. Fully Diluted Valuation
Market cap uses circulating supply. Fully diluted valuation, or FDV, uses the maximum supply instead: current price multiplied by max supply.
Cryptopedia separates three supply terms. Circulating supply is what is available now, total supply counts every coin created including locked ones, and max supply is the limit that will ever exist. Most projects do not release all tokens at launch; some are set aside for the team, staking rewards or ecosystem growth and released over time under a vesting schedule.
The gap between the two metrics can be wide. A project with a $50 million market cap could have an FDV of $500 million. If new tokens reach the market faster than demand grows, the extra supply may push the price down.
Bitcoin is a case where the gap is small. About 19.7 million coins have been mined out of a maximum of 21 million, so roughly 94% of the supply is already in circulation.
Coursera notes that some observers use the circulating figure and others use the fully diluted one, so readers should check which method a data site uses before comparing numbers. Cryptopedia warns that FDV can mislead: some projects include unreleased tokens in their figures to make comparisons look larger. Checking the token release schedule and the FDV-to-market-cap ratio gives a more balanced view.
Bitcoin and Dogecoin: How Supply Differs
Both coins are created through mining, but their rules differ. Dogecoin pays miners a flat 10,000 DOGE per block, with a block about every minute. That adds roughly 5.3 billion coins a year, and there is no maximum supply. Bitcoin's reward drops about every four years in an event called the halving; the network now creates around 164,000 BTC a year, and the supply is capped at 21 million.
Miners validate transactions and add them to the blockchain in groups called blocks. In return they earn new coins, which raises the total supply of both networks.
The yearly 5.3 billion new DOGE equal about 3.4% of the 156 billion already in circulation, while Bitcoin's 164,000 new coins equal about 0.8% of its roughly 19.9 million supply. That means Dogecoin dilutes holders about four times faster. Demand would need to grow about 3.4% a year for Dogecoin to hold its value, compared with about 0.8% for Bitcoin. If demand stays flat, each DOGE becomes a smaller piece of the network over time. The same holds for Bitcoin, but at a much slower pace.
In dollar terms the picture flips. Bitcoin's new coins are worth about $13.5 billion a year, while Dogecoin's are worth about $443 million. Bitcoin's next halving, expected in 2028, could cut its rate to about 0.4%.
Supporters of Dogecoin's design argue that a coin meant for spending needs a steady flow of new coins. Elon Musk has called the constant issuance "a feature, not a bug."
Bitcoin vs. Dogecoin: Market Value and Price Gap
Bitcoin's market cap is about $1.65 trillion, while Dogecoin's is about $13 billion, making Bitcoin worth roughly 125 times as much in total.
As of October 9, 2026, Dogecoin traded at about $0.08 — around 89% below its 2021 peak of $0.73. Bitcoin was priced at $82,462 the same day, about 35% below its all-time high of $126,080 from October 2025.
Price alone can hide these differences. A Dogecoin price of $0.08 sounds small next to $82,462, yet price per coin says little about total value. Market cap, at $13 billion against $1.65 trillion, shows the real difference in size.
Supply explains part of the gap. Dogecoin's 156 billion coins keep its price per coin low, while Bitcoin's supply of under 20 million keeps its price per coin high. But 3.4% yearly issuance cannot account for a market value gap this wide, and the source points to demand as the larger factor. Funds tied to Dogecoin, Litecoin and HBAR drew less than $10 million combined in the week leading up to October 4. Bitcoin's pull is steady and large, and interest in Dogecoin is much smaller by comparison, which fits the gap seen in market cap.
Dogecoin would need about a 735% gain to return to its all-time high. If its market value grows faster than its supply, the gap with Bitcoin could narrow.
Limits of Market Cap as a Metric
Market cap is a useful starting point, but it has limits. It is not a measure of money invested, because it is based on the latest price. If a token's price rises from $10 to $15, the market cap rises 50% — but that does not mean an equal amount of new money entered the market.
The money needed to move a price depends on market depth. In thin markets with low trading volume, a few trades can move the price and distort the market cap. Coursera makes a related point about volatility: because crypto prices can swing, the market cap of a coin can change a lot in a short time. Large-cap coins tend to be steadier, but they are not free of sharp moves.
Cryptopedia adds that the market cap of illiquid coins can be pushed up because of limited exchange activity, and that a high market cap does not guarantee profit.
Market cap does not measure project quality either. It reflects market pricing at one moment, not the technology, the team or long-term strength. A higher market cap points to a more established project, but it does not promise better returns.
Sources suggest reading market cap alongside trading volume, total value locked, on-chain activity, tokenomics and the FDV ratio. For comparing projects, market cap is usually more useful than price: a coin priced at a few cents can have a larger market cap than one priced in the hundreds of dollars if its supply is much bigger.
This article is for information only and is not financial advice.
Sources
- Crypto Market Capitalization Explained
- The Crypto Market Cap: A Guide for Beginners (Coursera)
- What Is Market Cap?
- Dogecoin Creates 5 Billion New Coins a Year and Bitcoin Is Capped at 21 Million. Does That Explain the Gap Between Them? (24/7 Wall St.)
- What Is Crypto Market Cap and Why Does It Matter? (Cryptopedia)
Originally published on CoinCentral.

