Five Indicators Analysts Watch to Gauge Whether a Crypto Market Bottom Is Near
Key Takeaways
- •Readings below 20 on the Crypto Fear and Greed Index signal extreme fear, which has sometimes aligned with long-term buying opportunities, though bearish conditions can persist for months.
- •A sharp decline in open interest following heavy liquidations may indicate that excess leverage has been flushed from the derivatives market.
- •Bitcoin's MVRV ratio below 1 shows the asset trading beneath its average cost basis, with readings under 0.8 historically appearing during severe stress near major cycle lows.
- •A higher low on price charts, a break above a previous high, and RSI bullish divergence can suggest a shift in market structure, but analysts say confirmation is still required.
- •Sustained inflows into US spot Bitcoin ETFs, which launched in January 2024, serve as a gauge of returning institutional demand, though a few days of inflows do not prove a lasting recovery.
Five Indicators Analysts Watch to Gauge Whether a Crypto Market Bottom Is Near
Bitcoin and other major cryptocurrencies have often fallen sharply before recovering, leaving investors to weigh whether to buy during declines or wait for lower prices. Market watchers track five indicators that may show selling pressure is easing, though none can pinpoint an exact low on its own.
Sentiment Falls to Extreme Fear
The Crypto Fear and Greed Index measures market mood using volatility, momentum and trading activity, with readings below 20 treated as extreme fear. The gauge runs from 0 to 100, with the midpoint near 50 marking neutral sentiment, giving readers a fixed scale for tracking whether fear is deepening or fading. In the past, widespread fear has sometimes coincided with long-term buying opportunities. Bearish conditions, however, can persist for months, and a low reading alone does not guarantee a bottom.
Liquidations Clear Out Leverage
Exchanges automatically close leveraged trades when collateral is no longer sufficient. This forced selling can push prices lower and trigger further liquidations, a cascade dynamic that explains why drawdowns can accelerate when leverage is widespread. Traders compare liquidation volumes with open interest, which tracks outstanding derivatives contracts. A sharp drop in open interest after heavy liquidations may indicate that excess leverage has left the market.
Bitcoin's MVRV Ratio Nears Past Lows
The Market Value to Realised Value (MVRV) ratio compares Bitcoin's market capitalization with its realized capitalization, showing whether holders are sitting on unrealized gains or losses. Realized capitalization prices each coin at the level where it last moved on Bitcoin's public ledger, which is what makes the comparison possible. According to Glassnode, a reading below 1 means Bitcoin trades beneath the network's average cost basis, while readings below 0.8 have appeared during periods of severe stress near major cycle lows. Those levels may not repeat, as Bitcoin's market structure continues to evolve.
Price Charts Stop Printing Lower Lows
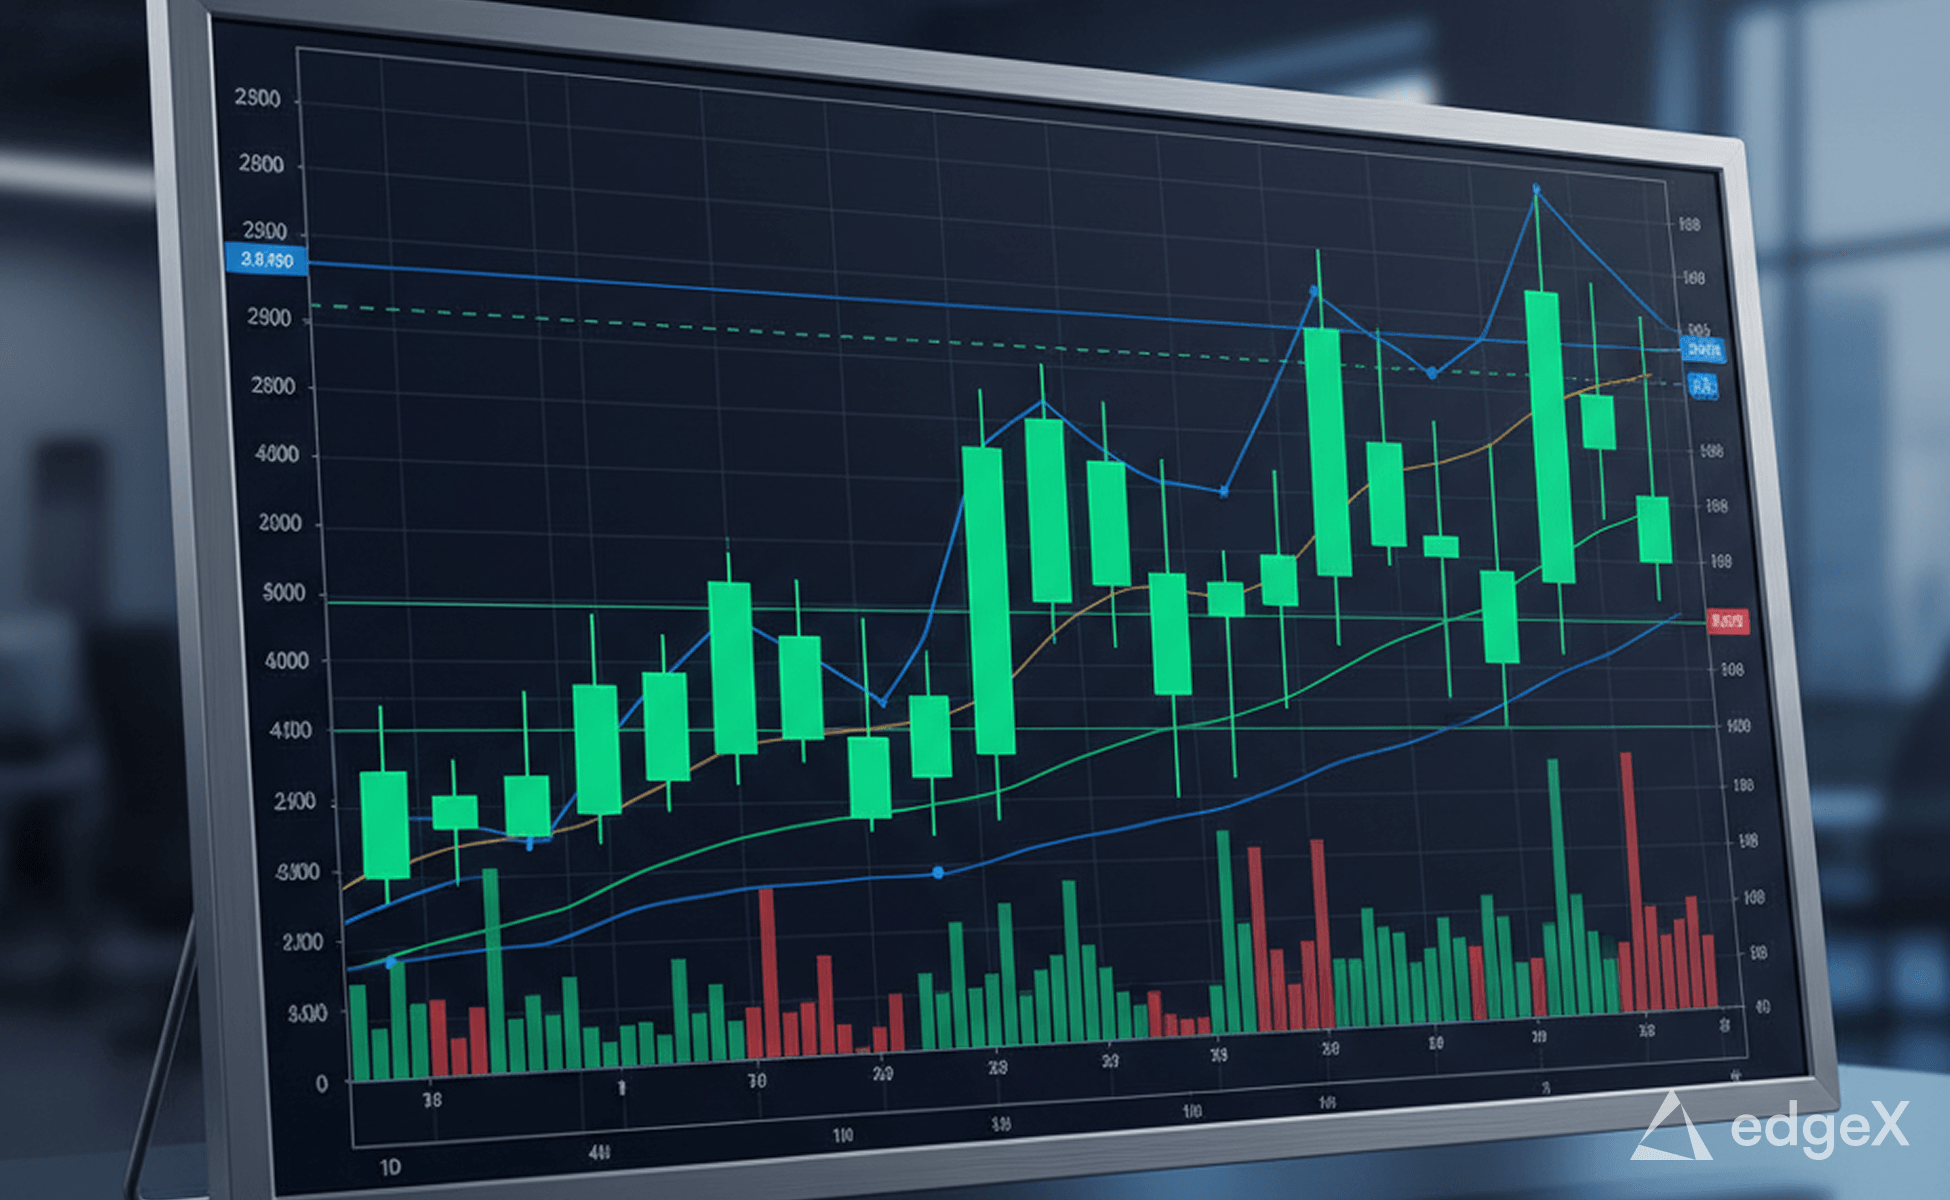
During prolonged bear markets, Bitcoin typically forms a series of lower highs and lower lows. A potential turn begins when the price stabilizes and forms a higher low, and a move above a previous high would add weight to that case. Analysts note that confirmation is still required.
The Relative Strength Index (RSI) measures price momentum, with readings below 30 signaling oversold conditions. Bullish divergence appears when price makes lower lows while the index makes higher lows.
ETF Flows Show Buyers Returning
Launched in January 2024, US spot Bitcoin exchange-traded funds hold Bitcoin directly and provide investors with a way to track institutional demand through daily flow reports. Steady inflows after a period of heavy withdrawals may suggest buyers are coming back. Flows are viewed alongside trading volumes, macroeconomic conditions and overall risk appetite, and a few days of inflows do not prove that a lasting recovery has begun.
Why Analysts Want Several Signals at Once
Analysts say no single signal marks the bottom. Instead, they look for several to appear together, including improved sentiment, lower leverage, stronger institutional demand and a confirmed change in price structure. A combined read carries more weight because each indicator measures a different layer of the market — crowd psychology, derivatives positioning, on-chain valuation, chart structure and institutional fund flows — rather than the same behavior from another angle. Even then, the signals describe market conditions rather than guarantee outcomes.
Dollar-cost averaging is one method investors use to avoid choosing a single entry point, though it does not protect against further losses.
This article is a standardized rewrite of reporting originally published by CoinCentral.

