Crypto Search Interest on Google Slumps to Lowest Since 2024, but Bitcoin Keeps Drawing Capital
Key Takeaways
- •Alphractal's 3 chart shows Google search interest in cryptocurrency at its lowest level since 2024, even as Bitcoin trades near $84,750 after recovering from earlier lows.
- •U.S. spot Bitcoin ETFs recorded approximately $2.39 billion in net inflows during September 21-25, followed by $148.7 million in outflows on September 30 and renewed inflows of $102.7 million and $31.7 million on October 1 and 2.
- •Google Trends scores reflect relative, sampled search prominence on a 0-100 scale, so declining readings indicate weaker attention but cannot count investors exiting the market or capture purchases made through exchange apps and brokerage accounts.
- •ETF flows reveal a demand channel that searches do not directly measure, though they cannot identify whether individuals or institutions supplied the money.
- •A rally with fading public attention becomes fragile if buying activity and order-book depth also weaken, so recovery should be assessed across searches, spot volume, ETF flows, and tokens holding their gains over multiple sessions.
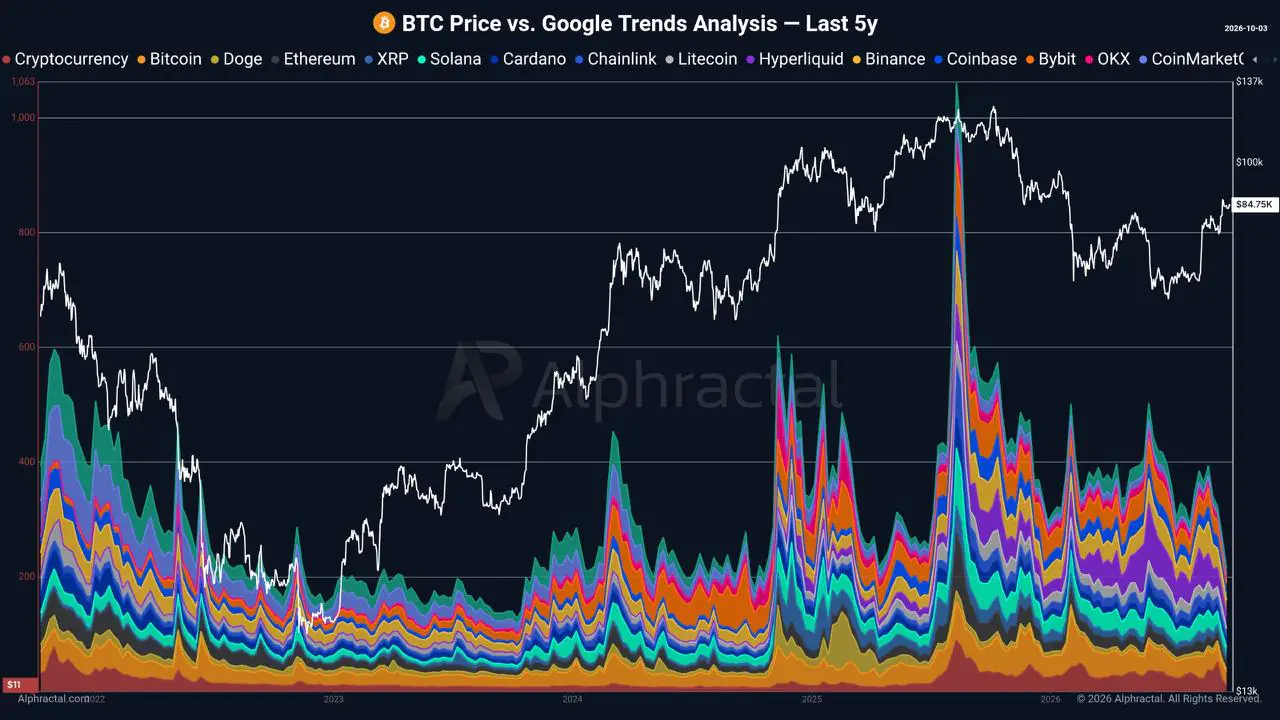
Alphractal reports that Google search interest in cryptocurrency has fallen to its weakest level since 2024. The analytics firm's October 3 chart places Bitcoin near $84,750 after a recovery from earlier lows, yet the search series remain well below the large spikes recorded in 2025 — suggesting the current price recovery has drawn far less public curiosity than those earlier bursts of activity.
That divergence leaves room for several interpretations. Existing investors may continue holding or trading without researching crypto again, while new buyers can enter through services they already use. Distinguishing those possibilities from a genuine retreat in demand requires evidence beyond search data.
What Falling Google Interest Actually Measures
Google Trends measures relative search interest: how prominent a topic is among searches within a selected location and period. Its scores are based on sampled data and scaled for comparison, rather than reporting an absolute search count. Each score sits on a 0–100 scale, where 100 marks the topic's peak popularity within the chosen window, so a reading of 20 means one-fifth of that peak prominence rather than a specific number of searches. A decline can indicate weaker attention, but it cannot count investors leaving the market.
Alphractal's chart stacks search series for assets, exchanges and platforms, including Bitcoin, Ethereum, Binance and Coinbase. The firm does not disclose how those series were combined, or whether the sharp drop at the end of the chart covers a completed period. The “lowest since 2024” finding therefore remains attributed to Alphractal; the image alone does not establish an exact percentage fall in searches.
Searches also capture different motives. Someone checking an exchange during a crisis can push interest higher without any intention to buy. Conversely, a regular customer can open an exchange app and place an order without searching Google at all. Brokerage access adds another way for investment activity to escape this attention measure.
Bitcoin Buying Has Another Route
A brokerage customer can buy a Bitcoin exchange-traded fund (ETF) without opening a crypto exchange account or learning how to manage a wallet. U.S. spot Bitcoin ETFs, which began trading in January 2024, made that route available through standard brokerage accounts. That makes ETF flows a useful complement to search data: they record money entering or leaving listed products, rather than people looking for information.
Figures from Farside Investors show approximately $2.39 billion in net inflows into U.S. spot Bitcoin ETFs during September 21–25. Demand subsequently turned uneven, with $148.7 million in net outflows on September 30, followed by $102.7 million in net inflows on October 1 and $31.7 million on October 2.
The figures establish that money entered through listed products in late September and again on October 1. They do not identify who supplied it: ETFs serve individuals and institutions alike, so inflows cannot establish that institutional investors have replaced retail buyers. What they demonstrate is a channel of demand that Google searches do not directly measure.
Selected altcoins have also recorded strong gains. Coindoo's October 1 review of crypto gainers documented advances in Stacks, Midnight, NEAR, FET and Ethena. Whether those gains survive subsequent selling will reveal more about their support than their position on a single day's gainers list.
When Fewer Buyers Make a Rally Fragile
As holders take profits, the market needs buyers willing to absorb their sales. Spot trading volume shows how much trading has occurred, while order-book depth shows the buy and sell orders available near the current price. High volume alone does not establish that money is entering, but the two measures together help assess how readily trades can be executed.
Consider a hypothetical $100,000 market sell order. If substantial buy orders sit close to the current price, the sale may be absorbed with limited movement. If those bids are sparse, the same order may execute against progressively lower prices. A relatively modest sale can therefore cause a large price move in a thin market.
Fading attention becomes more consequential when buying activity and available bids weaken as well. In that situation, holders seeking to exit may find fewer buyers near the prices reached during the rally. This is a condition to check with trading data, rather than one already established by Alphractal's search chart.
Evidence of a Broader Recovery
To assess whether participation is rebuilding, search interest can be compared with spot activity, ETF flows and the number of tokens holding their gains. Each measure addresses a different part of the recovery.
A rise in searches without stronger market activity would offer limited evidence that curiosity is turning into purchases. Conversely, persistent investment inflows and deeper order books could support a recovery while searches remain subdued. Watching these measures over several sessions is more informative than treating one low reading or one strong inflow day as decisive.
The harder test comes when holders sell into the recovery. Prices that retain their gains through profit-taking would suggest buyers are absorbing that supply. Repeated reversals would indicate that buying is struggling to sustain higher prices, even if public interest starts to return.
This article is for informational purposes only and does not constitute investment advice. Search interest is an attention indicator and does not reliably predict cryptocurrency prices.
This article originally appeared on Coindoo.

