Crypto Bankruptcy Statistics 2026: Exchange Failures, Investor Losses and Risk Factors
Key Takeaways
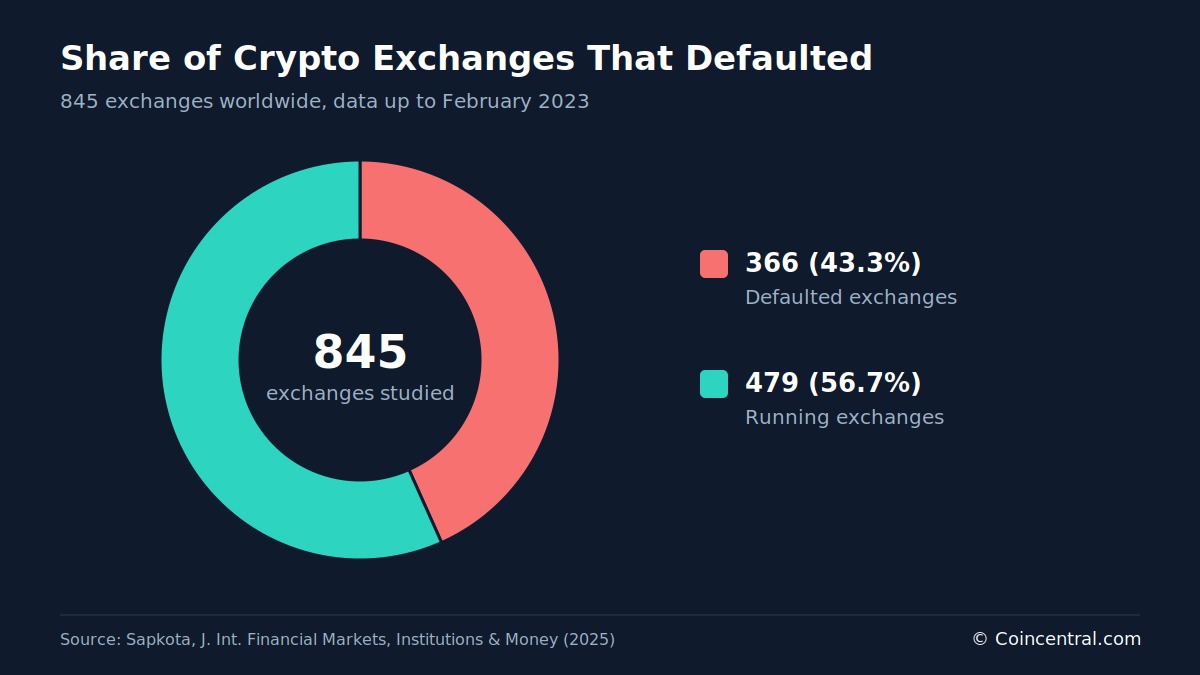
- •A study of 845 crypto exchanges classified 366, or 43.3%, as defaulted by February 2023, far exceeding annual bankruptcy rates of about 1% on traditional stock markets.
- •The BIS estimated that more than $1.8 trillion in crypto market value disappeared during 2022, with the TerraUSD and FTX collapses accounting for approximately $650 billion of that loss.
- •BIS app-usage data suggest most new users entered after prices had already risen, and under its buying assumptions the median investor had lost $431 of $900 invested by December 2022.
- •Operating exchanges averaged 5.6 years of existence compared with 3.0 years for failed ones, and longer operating histories, more listed coins and certification were associated with lower default odds.
- •A summary report counted 3.7 million failed tokens out of nearly 7 million listed since 2021, a 52.7% failure rate, though the report did not disclose its methodology.
Crypto failures have affected exchanges, tokens and individual investors. This article brings together findings from three research papers and one summary report on the frequency of failures, the losses involved and the factors associated with collapse.
The sources examine exchange defaults, crypto market-value losses, retail trading outcomes and models designed to identify failing exchanges. Their periods, methods and definitions differ, so the figures should not be added together. Each section reflects the source study or report identified. For readers, the record speaks to a risk specific to crypto: many exchanges hold customer assets directly, so a platform failure can leave users unable to reach their funds, as the sections below describe.
Exchange and Cryptocurrency Failure Rates
A study byiranjan Sapkota examined 845 crypto exchanges worldwide using data available through February 2023. It classified 366 exchanges as defaulted and 479 as still operating, meaning 43.3% of the sample had failed.
In the study, a default means that an exchange stopped operating, encountered financial trouble or was declared bankrupt. The data was collected from Coinmarketcap.com, Cryptowisser.com and Coingecko.com.
Sapkota wrote that, since the collapse of Mt. Gox, once the world’s largest bitcoin exchange, in 2014, roughly 60% of crypto exchanges had experienced defaults. The causes included fraud, cyberattacks and government regulation. By comparison, bankruptcy was much less common among companies listed on traditional stock markets. The study cited research showing that less than 1% of NYSE-AMEX firms and slightly more than 1% of NASDAQ firms go bankrupt in a given year.
A separate measure illustrates how many listed exchanges may be inactive. In April 2023, CoinMarketCap listed 609 exchanges, but only 237 had recorded at least $1 in trading during the preceding 24 hours.
Cryptocurrency projects also showed high failure rates. A 2020 study cited by Sapkota found that about 60% of cryptocurrencies defaulted between 2014 and 2018 because of scams, hacks and business failures.
The study noted that its crypto sample contained nearly equal numbers of defaults and surviving exchanges. That differs from stock-market datasets, where bankrupt firms account for about 1% of observations and are therefore more difficult to model. Because the crypto sample was relatively balanced, the researchers did not need to use data-balancing techniques.
The 2022 Market-Value Loss
The Bank for International Settlements (BIS), the Basel-based institution owned by member central banks, examined the 2022 crypto crash in BIS Bulletin No. 69, published in February 2023. Crypto prices peaked in November 2021. During 2022, the prices of many coins, including bitcoin and ether, fell by about 75% from those levels.
More than $1.8 trillion in crypto market value disappeared as prices declined. Two events accounted for a substantial part of the loss.
In May 2022, the algorithmic stablecoin TerraUSD, designed to hold its $1 value through code and market incentives rather than cash reserves, fell from $1 to almost zero within a few days. More than $450 billion in crypto and decentralized-finance (DeFi) value was destroyed between May and June.
In November, the FTX exchange, at the time one of the largest crypto trading platforms, collapsed after a run prompted by concerns about its cash position and solvency. Another $200 billion was lost, while bitcoin, ether and other cryptocurrencies declined by more than 20% within days.
Together, the TerraUSD and FTX events accounted for approximately $650 billion, or about 36% of the total market-value loss measured by the BIS.
Trading activity increased during both episodes. Daily active users on Binance, Coinbase and FTX rose after news of the problems emerged. The BIS found that large holders, or “whales,” defined in the bulletin as wallets containing more than 1,000 bitcoin, reduced their holdings in the days following each shock. Holders with less than one bitcoin increased their holdings.
The BIS said this pattern suggested that larger investors sold to smaller investors before the sharpest price declines. It also found little visible effect from the crypto crash on broader financial markets outside the crypto sector.
Where Exchange Failures Occur
Exchange failures have followed several recurring patterns. Some platforms closed after legal action, some were hacked and others disappeared without providing an explanation.
Between 2014 and February 2023, business problems, regulatory difficulties and scams were associated with failures at broadly similar rates, according to the Sapkota study. After 2018, however, most failed exchanges simply vanished without stating a reason, leaving customers without clear information about their funds.
The geographic figures do not directly identify the riskiest jurisdictions because they are counts rather than failure rates. Singapore recorded the largest number of defaults, at 41, but also had 55 operating exchanges. Hong Kong had 29 defaults. Asia had the largest number of operating exchanges, at 129, while Europe had the largest number of defaults, at 60.
The United Kingdom, the United States and Australia each had equal numbers of operating and defaulted exchanges. These totals indicate where exchanges were based, but do not establish that one location had a higher probability of failure than another.
Custodial exchanges, which hold customer assets, create a particular exposure for users. The QuadrigaCX case, in which the founder of the Canadian exchange died in 2018 while holding sole control of the wallet keys, demonstrated how a single person controlling the only keys to wallets could prevent thousands of customers from accessing their funds.
Stock exchanges rarely fail in the same way because they do not generally hold customer money under comparable arrangements and operate within strict regulatory systems. Many crypto exchanges, by contrast, have operated in legal gray areas, making accountability more difficult.
A separate summary report counted at least 17 major exchange bankruptcies since 2009. It said that more than five exchanges collapsed in 2022 alone, following the failures of TerraUSD and FTX. The report estimated investor losses from exchange bankruptcies at well above $30 billion, with a headline range of $30 billion to $50 billion.
Retail Users and Estimated Losses
The BIS created a database of crypto-exchange app usage in 95 countries, covering August 2015 through mid-December 2022. The database included more than 200 apps and used downloads as a proxy for the number of new users.
Between August 2015 and November 2021, bitcoin’s price rose from $250 to $69,000. During the same period, the global monthly average of daily active users increased from approximately 100,000 to more than 30 million.
New users generally arrived after prices had already risen. On average, user numbers lagged price increases by about two months. Nearly three quarters of users downloaded a crypto app when bitcoin was trading above $20,000, meaning many entered at comparatively high prices before the 2022 decline.
To estimate investor outcomes, the BIS assumed that every new user bought $100 of bitcoin in the month of the first download and continued buying $100 each month afterward. Under that assumption, the median investor would have lost $431 by December 2022, almost half of the $900 invested. The estimate translates the entry-timing pattern described above into dollar terms for a typical user.
In nearly all countries in the dataset, a majority of users were estimated to have lost money. The proportion was higher in emerging markets including Brazil, India, Pakistan, Thailand and Turkey. If users continued investing each month, more than four-fifths were estimated to have lost money.
The BIS emphasized that these were estimates based on application data rather than individual account records. App usage also differed substantially by country. Some locations had fewer than one monthly user per 100,000 residents, while others had at least 1,500.
Countries with high download totals included Australia, Canada, the Netherlands, the United Kingdom, the United States, Singapore, Turkey and the United Arab Emirates.
The BIS also examined the factors associated with new users joining crypto platforms. Bitcoin’s price was a significantly stronger predictor of new-user activity than stock-market performance, gold prices or global uncertainty. In practical terms, users tended to enter when prices were already high and rising, a subsequent decline in the period studied.
Bitcoin and Bankruptcy Probability
A 2022 paper by Serhii Kozlovskyi and colleagues examined a different question: how likely an investor was to become bankrupt by holding bitcoin. The authors used Monte Carlo simulations, which run numerous random scenarios, on data covering September 1, 2014, through July 1, 2022. Unlike the platform failures discussed elsewhere in this article, the paper’s concern was the financial ruin of individual holders.
The researchers selected bitcoin because they described it as the first decentralized cryptocurrency and the asset with the longest price history. Their results indicated that the long-term range of bankruptcy probability was below the short-term range. The authors said this contradicted a common belief and wrote that investors seeking to avoid bankruptcy should favor a long-term approach.
They also suggested that alternating long and short investment periods was the best method for crypto investors seeking to protect themselves. The study defined bankruptcy as the result of tail events: rare but severe price movements capable of wiping out an investor’s funds.
The paper estimated that bitcoin had around 25 million holders, representing 42.2% of the crypto market, and stated that more than 10,000 types of cryptocurrency existed. The authors reported that almost all coins had been shown to follow bitcoin’s movements.
The authors also noted that crypto assets were not regulated in the same way as many other financial assets. Investors did not receive the same protections available with stocks or bonds, and the study said each investor had to choose a strategy consistent with their objectives and limits.
Features Associated With Exchange Survival
Sapkota compared average characteristics of operating and defaulted exchanges. Some differences were substantial, while others were not large enough to distinguish from random variation.
Operating exchanges listed more coins, received higher ratings and had existed for longer periods. Defaulted exchanges were much more likely to lack certification and referral programs.
Age was the clearest difference. Operating exchanges had been open for approximately 5.6 years on average, compared with 3.0 years for exchanges that failed.
Trading fees produced a different result. Average maker and taker fees did not differ by an amount that could be distinguished from chance. The same applied to the average transparency score of the exchanges’ home countries.
The study also used logit and probit models to estimate how individual factors affected default probabilities while holding other variables constant. Both models produced the same principal results: the odds of default declined as the exchange’s years of operation and number of listed coins increased. These relationships describe tendencies in the sample rather than guarantees; the record includes failures of large, long-standing venues such as Mt. Gox.
The author urged caution when interpreting other findings. A basic comparison did not show a clear difference between decentralized and centralized exchanges. Decentralized exchanges represented 12% of the defaulted group and 18% of the operating group.
Results related to U.S. access and transparency may have reflected differences in oversight. Exchanges serving U.S. customers, or based in countries with stronger disclosure rules, may have been more likely to have failures detected and recorded. In a breakdown by cause, access to the U.S. market was associated only with defaults attributed to scams. The author suggested that open, well-regulated markets may also attract fraudulent activity.
Exchange-Failure Prediction Models
The Sapkota study tested whether publicly available information could distinguish failing exchanges from operating ones. The logit model achieved 81.18% accuracy, while the probit model reached 81.42%.
The author also tested machine-learning techniques. Results varied depending on the portion of the data used to train each model. Random forest initially recorded the highest score, but its accuracy dropped sharply when 90% of the sample was used for training, suggesting that performance was sensitive to the data split.
Five-fold cross-validation produced more stable results. Random forest achieved 81.7% accuracy, the support-vector machine reached 80.5% and gradient boosting scored 78.9%.
XGBoost recorded 100% accuracy in one test. Because the sample contained only 845 exchanges, the author treated this result as evidence that the model may have memorized the data rather than generalized from it. Naive Bayes produced the lowest result, between 59% and 63%.
A stacked model combining all five machine-learning methods achieved between 81.7% and 83.4% accuracy. Most of its predictive strength came from the gradient-boosting component, indicating that the additional methods contributed relatively little.
The study concluded that traditional models producing accuracy of about 81% performed comparatively well against more complex tools. Public information can identify indicators associated with risk, but cannot predict every exchange collapse.
Failed Tokens and Limitations of the Data
Exchanges are only one part of the crypto-failure record. A summary report also counted tokens that stopped trading or were abandoned. It said that, of nearly 7 million cryptocurrencies listed since 2021, 3.7 million had failed, equal to 52.7% of all projects.
The report attributed 1.8 million failures to the first quarter of 2025 alone. It listed lack of use, weak security, rug pulls and scams, market volatility and regulatory pressure among the causes; rug pulls are schemes in which a project’s developers abandon a token and abscond with investors’ funds.
It estimated that token failures in the first quarter of 2025 represented nearly $250 billion and that total investor losses exceeded $2 trillion. However, the report did not disclose its methodology. Those figures therefore warrant more caution than the peer-reviewed estimates cited above.
An earlier study cited by Sapkota found that newer coins were more likely to fail than older ones. Taken together, the sources indicate that failures have been common across exchanges and tokens, while retail users have borne a substantial share of the losses.
Exchange age, the number of listed coins and certification were all associated with survival in the Sapkota data. The BIS found that the 2022 crash remained largely within crypto markets and had little visible impact on broader financial markets.
The findings have important limitations. They rely heavily on publicly available records, use different definitions and time periods, cover exchanges only through February 2023 and cannot establish cause and effect in every relationship. Because the exchange dataset ends in February 2023 and the token report runs only through the first quarter of 2025, failures after those dates are not captured here; updated versions of these datasets, or new studies applying the same methods, would show how the record has changed since.
Sources
- Assessing the probability of bankruptcy when investing in cryptocurrency.2022.26) (Kozlovskyi et al., 2022)
- Crypto shocks and retail losses, BIS Bulletin No. 69 (Cornelli, Doerr, Frost and Gambacorta, 2023)
- The crypto collapse chronicles: Decoding cryptocurrency exchange defaults (Sapkota, 2025)
- [Original article on CoinCentralhttps://coincentral.com/crypto-bankruptcy-statistics/)

