CoinGlass: Bitcoin Futures Liquidations Hit $143 Million in 24 Hours
Key Takeaways
- •CoinGlass recorded roughly $143 million in Bitcoin futures liquidations over the 24 hours ending at 06:53 UTC on October 7, 2026.
- •The total covers forced closures of leveraged long and short positions across centralized exchanges, encompassing both perpetual and dated futures contracts.
- •The dataset provides no long-versus-short breakdown or exchange-level attribution, so the figure measures risk volume without indicating positioning direction.
- •Compared with earlier episodes such as $132 million in single-day Bitcoin short liquidations and crypto-wide liquidations exceeding $1 billion, the latest total ranks toward the smaller end.
- •Evaluating whether the closures sparked further price moves would require funding rates, open interest trends, and exchange reserve flows, none of which are included in the current data.
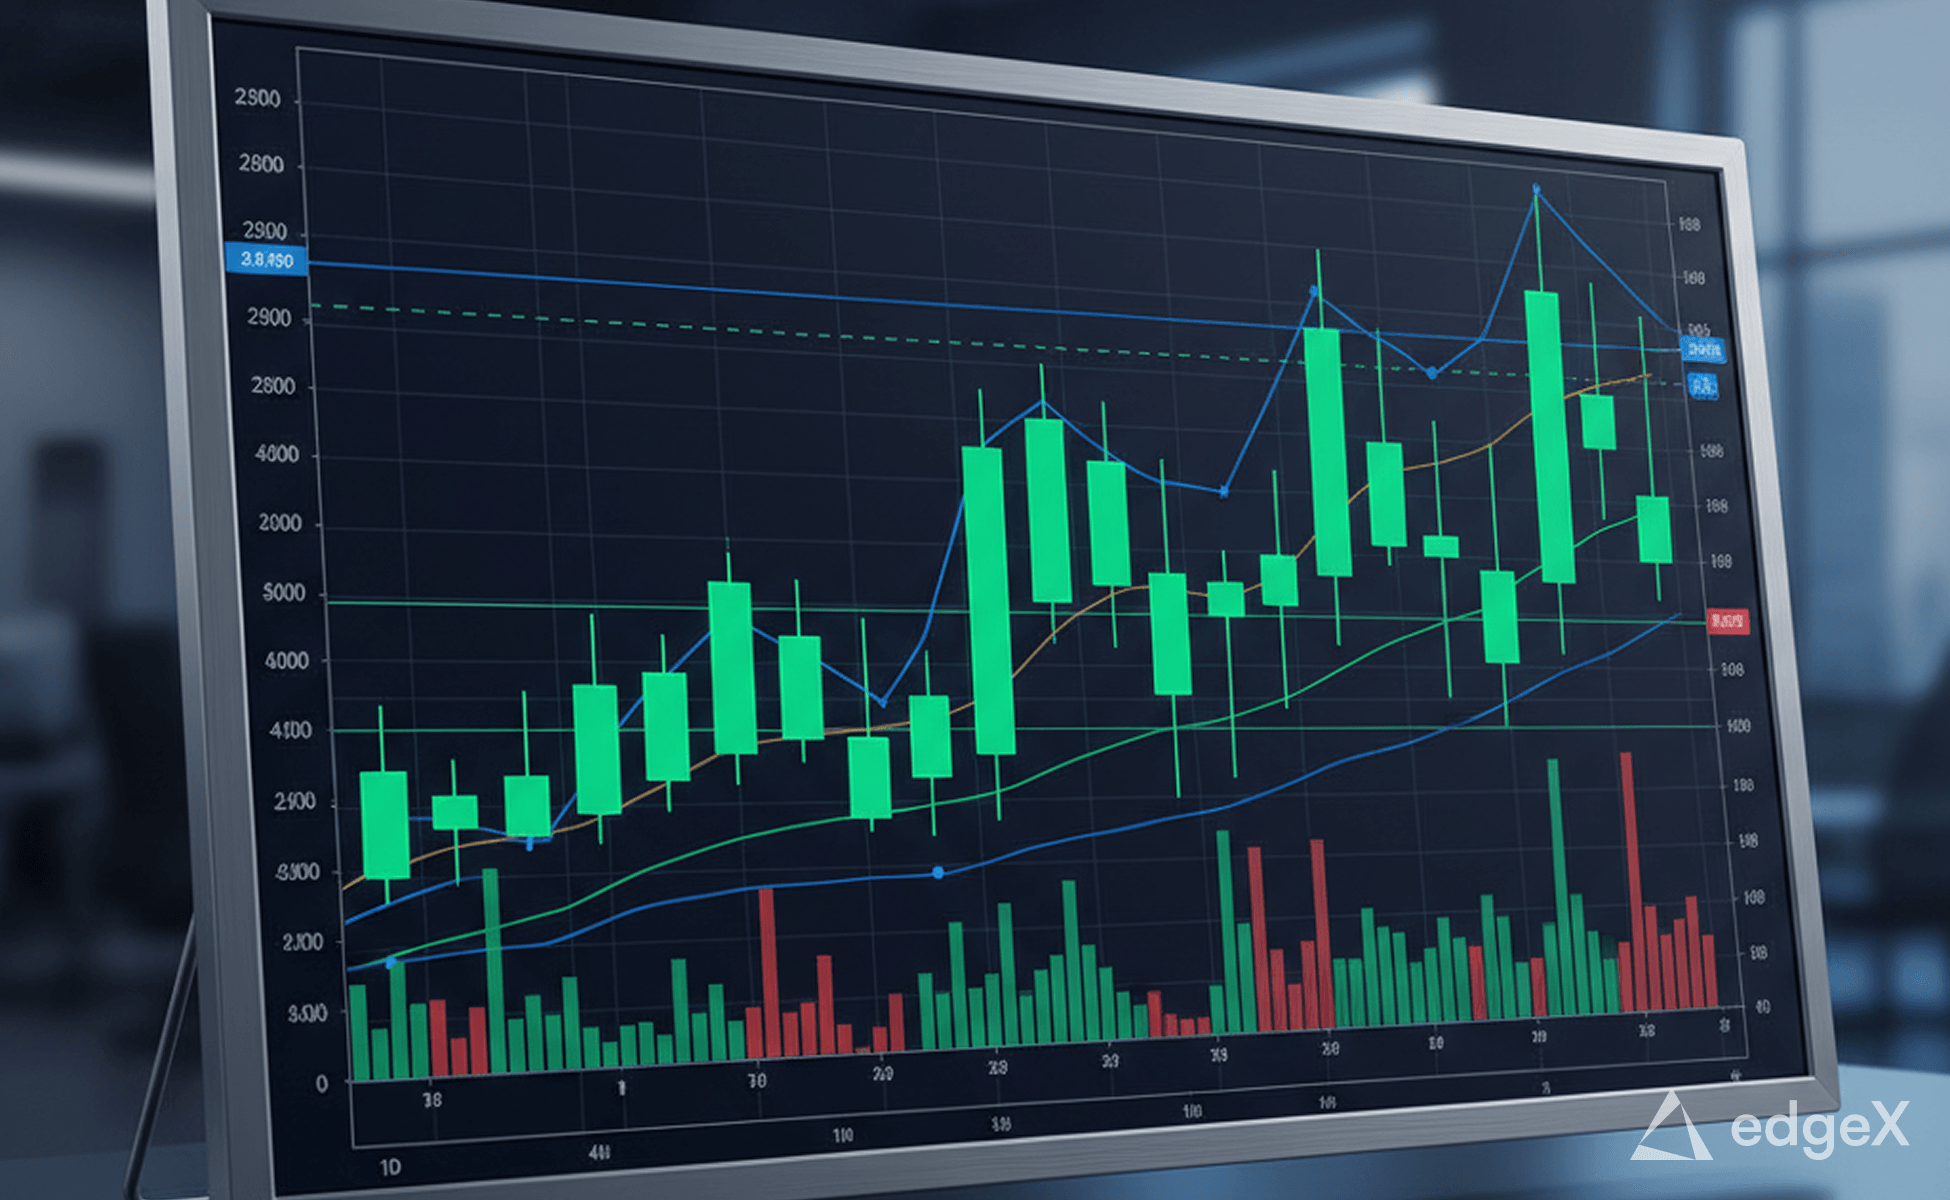
CoinGlass recorded approximately $143 million in Bitcoin futures liquidations over the 24 hours ending at 06:53 UTC on October 7, 2026. The figure reflects forced closures of leveraged Bitcoin (BTC) positions across centralized derivatives venues, covering both perpetual and dated futures contracts. CoinGlass, an industry data aggregator, tracks forced closures across major centralized exchanges, making its dataset a widely used reference for gauging deleveraging activity in the crypto derivatives market.
CoinGlass Reports About $143 Million in Bitcoin Futures Liquidations
The aggregate total, drawn from CoinGlass liquidation data, captures positions that exchanges forcibly closed during the measurement window. Under standard margin rules, when a leveraged position moves against a trader beyond the maintenance margin requirement, the exchange liquidates that position to prevent a deficit on its books, recording the notional value of the trade as a liquidation event. Both long and short positions feed into the aggregate print. Perpetual contracts — derivatives with no expiry date that track spot prices through periodic funding payments between long and short holders — are the standard vehicle for leveraged crypto trading on centralized venues. Liquidation prints like this one are also inherently backward-looking: they register leverage already flushed from the market rather than signaling what comes next.
The supplied data does not break the total down into long versus short liquidations, nor does it attribute the figure to specific venues. That directional split matters for reading positioning pressure: a long-dominant cluster signals deleveraging from bullish bets, while a short-dominant event reflects a squeeze on bearish exposure. Without the breakdown, the approximately $143 million figure stands as a gauge of risk volume rather than a directional read on positioning, and no single exchange's share of the total can be identified.
Comparable episodes have appeared before. Bitcoin short liquidations previously reached $132 million in a single 24-hour window, reinforcing that nine-figure liquidation days have become a recurring feature of the BTC derivatives stack. The broader market has also logged more extreme events, with cryptocurrency liquidations topping $1 billion during peak volatility episodes. Measured against those precedents, the current total sits toward the smaller end of the range — notable as a single-day figure, yet well below the extremes the market has recorded.
What the Liquidation Total Means for Futures Risk
Aggregate liquidation data functions as a leverage-cleansing metric. High totals over a compressed window indicate that open interest carried significant embedded leverage and that a price move was sufficient to trigger forced closures at scale. The mechanism is mechanical: margin engines execute without regard for market sentiment.
What the figure does not indicate on its own is whether the forced closures contributed to further price movement or were absorbed without triggering a cascade. For that assessment, traders typically cross-reference funding rates, open interest trajectory, and exchange reserve flows — none of which are available in the current data set. A CryptoSlate analysis of liquidation waves and ETF flow dynamics provides structural framing on why positive ETF inflows do not automatically provide a price floor during deleveraging events.
Bitcoin's derivatives market has previously seen sharp price repricing follow large liquidation windows, as documented when Bitcoin's price fell 17% amid a broad market liquidation event. Whether the October 7 window follows a similar pattern depends on price action data not present in the current research brief. A subsequent CoinGlass update that includes the long–short split would supply exactly the directional read the current aggregate lacks.

