China's Gold Imports Surge to 173 Tonnes in June, Marking Highest Monthly Total Since March 2024
Key Takeaways
- •China imported 173 tonnes of gold in June 2026, marking its largest monthly import total since March 2024.
- •First-half 2026 gold imports reached approximately 820 tonnes, nearly double the same period in 2025 and just below the record first-half total of 830 tonnes.
- •Retail buyers increased purchases after gold declined from above $4,500 in early June to around $4,000.
- •Chinese banks raised imports to replenish inventories that had been reduced by strong retail demand.
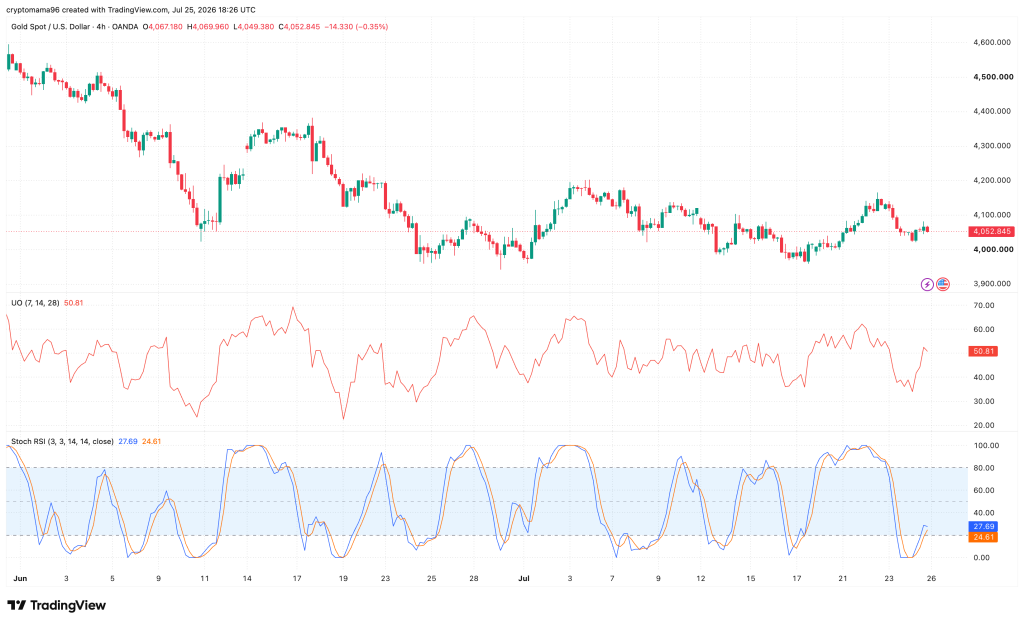
- •Gold is trading near $4,053, with support around $4,000–$4,020 and resistance around $4,100–$4,150.
China imported 173 tonnes of gold in June 2026, the largest monthly import figure since March 2024 and the third consecutive month of increasing imports for the world's largest consumer of the metal.
The total for the first half of 2026 now stands at approximately 820 tonnes, nearly double the amount recorded during the same period in 2025. This marks the second-highest first-half total on record, falling just 10 tonnes short of the all-time record of 830 tonnes set in 2025. The data underscores that Chinese demand for gold remains robust, and it gives market participants another gauge of physical demand alongside ETF flows, bank inventory needs, and retail buying activity.
China's Gold Buying Spree: The Numbers Behind the Surge
While the June figure of 173 tonnes is notable, the broader trend is equally significant. Monthly gold import data for China from 2021 to 2026 reveals a steady upward trajectory over the period.
In January 2021, imports stood at 30 tonnes. The data shows readings of 100 tonnes in April 2024, 25 tonnes in May 2025, and a peak of 100 tonnes in March 2026. Although monthly figures fluctuate, the cumulative first-half total of 820 tonnes confirms that demand has strengthened considerably year over year.
What Is Driving the Surge?
Two primary factors are driving this wave of gold imports. First, retail investors have been purchasing at lower price levels. Gold declined from above $4,500 in early June to approximately $4,000, and Chinese investors took advantage of the pullback to acquire physical metal.
Second, Chinese banks have ramped up gold imports to rebuild depleted inventories. Strong retail demand had drawn down stockpiles, prompting financial institutions to replenish their holdings. That makes bank import activity important to watch because it can reflect both current consumer demand and the need to restock after earlier buying.
Gold-backed ETFs in China have also attracted 28 tonnes of inflows year-to-date, reflecting sustained institutional and retail interest in the asset.
Gold's Current Price Action
On the 4-hour XAU/USD chart, gold is trading near $4,053, positioned in the middle of its recent range. The market structure remains bearish, characterized by a sequence of lower highs and lower lows dating back to early June. The decline from above $4,500 has moderated over the past several weeks, and price action has entered a consolidation phase.
Over the last two weeks, the market has moved sideways within well-defined boundaries. Support sits at $4,000–$4,020, while resistance is located at $4,100–$4,150.
Momentum indicators are sending mixed signals. The Ultimate Oscillator reads 50.81, hovering near the neutral 50 level, suggesting that neither buyers nor sellers hold a decisive momentum advantage. However, the Stochastic RSI has just crossed higher from oversold territory, which typically serves as an early bullish signal.
Key levels to watch:
- Immediate resistance: $4,080–$4,100
- Stronger resistance: $4,150–$4,180
- Primary support: $4,000–$4,020
- Secondary support: $3,950–$3,970
A breakout above $4,180 would challenge the recent series of lower highs and could put the $4,250–$4,300 area back in focus. Conversely, a decisive close below $4,000 would bring attention to the $3,900 area.
What This Means for the Gold Price Going Forward
Chinese demand remains one of the most important fundamental factors being monitored at current price levels. The 820 tonnes imported in the first half of 2026 represent substantial physical offtake, which is relevant because physical buying can affect available supply even when short-term price action is being shaped by technical levels and macroeconomic drivers.
In a bullish scenario, buyers defend the $4,000 support level. The Stochastic RSI crossover gains traction, and gold rebounds toward $4,100. A break above $4,150 would strengthen bullish momentum, and sustained buying above $4,180 would challenge the medium-term bearish structure. The Chinese import data supports the case that physical demand remains firm during the current consolidation.
In a bearish scenario, the price fails to hold above $4,000. Sellers retest $3,950, and continued selling pressure extends losses toward $3,900. Chinese buying could decelerate if the price falls further, as banks and investors may wait for a confirmed bottom before re-entering the market.
Gold Price Outlook: What's Next
The near-term setup points to a range-bound market. As long as price remains between $4,000 and $4,150, the market remains in consolidation. The next meaningful directional signal would come from a confirmed move beyond this range.
Short-term momentum is improving following the Stochastic RSI bullish crossover, and Chinese import data confirms that physical demand remains firm. This combination gives the short-term setup a modest bullish tilt, though a confirmed breakout above $4,150 would be needed to signal a more durable shift in structure.
The overall medium-term bias remains neutral to slightly bearish, while the short-term setup leans toward a rebound attempt. Support at $4,000–$4,020 remains the key area to monitor. If gold can reclaim $4,150 and eventually $4,180, the bearish structure would begin to weaken.
Gold prices are influenced by a range of factors including interest rates, inflation, central bank purchasing activity, geopolitical events, and the strength of the U.S. dollar. Prices could face downside pressure in 2026 if inflation eases, interest rates remain elevated, or investor demand softens. At the same time, economic uncertainty or continued strong central bank buying could lend ongoing support.

