Chainlink Price Down 41% Since September: Is $9 the Floor?
Key Takeaways
- •LINK trades around $9.22, nearly where it stood on November 15, leaving it roughly 41% below the late-September peak of $15.76.
- •The 0.786 Fibonacci retracement near $8.81 has held on daily closes, with only intraday wicks dipping below it, reaching about $8.62 during the November 15 sell-off.
- •The 50-day SMA has fallen to $11.65 and sits just under the 100-day SMA at $11.70, a setup that a daily close would confirm as a death cross associated with medium-term weakness.
- •UBS used Chainlink to execute key lifecycle steps for a tokenized structured note on Ethereum in a production pilot aimed at the $2 trillion-plus structured products market, though the announcement does not link the pilot to LINK purchases.
- •A decisive daily close below $8.81 would remove the last nearby Fibonacci support and put the $7-$7.95 demand zone and the June low at $6.92 back in view.
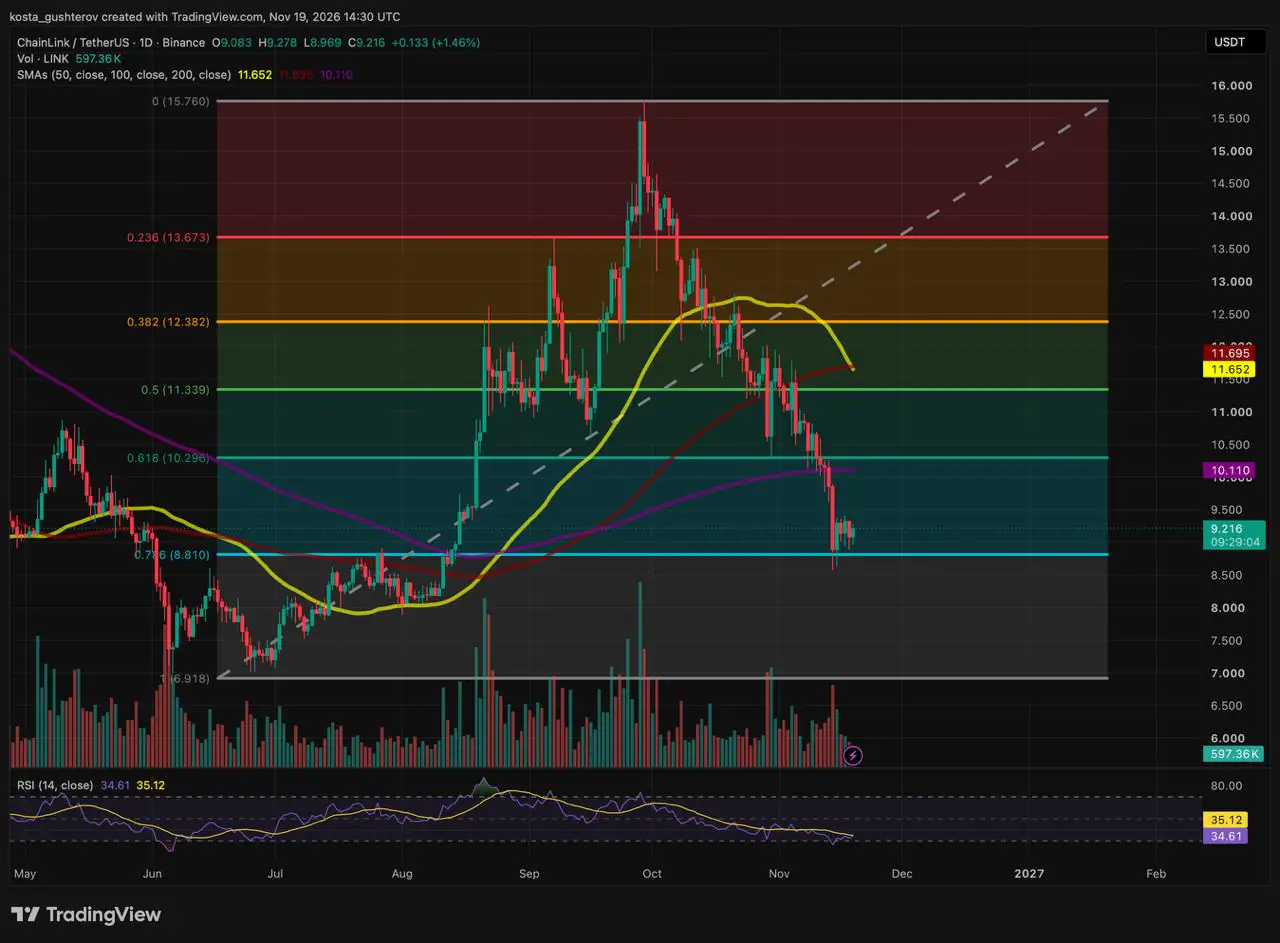
When Coindoo last checked in on Chainlink on November 15, LINK had just bounced 4% after five consecutive down days, and the open question was whether that move marked a turn or merely a pause. Four trading sessions later, the chart leans toward the latter — LINK now trades roughly 41% below the late-September peak at $15.76.
What Changed Since the November 15 Bounce
LINK has printed a row of small daily candles just above $9 and trades around $9.22 on the Binance daily chart, almost exactly where it stood on November 15. Today's session opened at $9.08, dipped to $8.97, and has since climbed to $9.22 — a 1.46% gain with more than nine hours of trading still remaining. Buyers keep defending the $9 area, but they have not lifted the price far from it.
Trading activity has thinned out as well. The heavy red volume bar from the mid-November breakdown still towers above anything traded since, and today's session has drawn roughly 597,000 LINK so far.
The session also brought news from traditional finance. UBS has used Chainlink to run key lifecycle steps for a tokenized structured note on Ethereum, in what the two firms describe as a production pilot for a market they put above $2 trillion in outstanding notional. For LINK holders, the connection is indirect: Chainlink's standard company description refers to a model in which enterprise revenue is converted into LINK and held in the Chainlink Reserve, but the announcement does not tie the UBS pilot to that model. On the chart, the day's modest gain keeps LINK inside the same narrow range.
The Floor Holding LINK Up
That floor is the 0.786 Fibonacci retracement near $8.81. The retracement is measured from the June wick low of $6.92 to the late-September peak at $15.76, which places the level slightly below the $8.89 used on November 15, when the swing low was set at $7.02.
So far, only wicks have broken it. The November 15 sell-off reached about $8.62 before buyers stepped in, and no daily candle has closed below $8.81 since. Many traders treat the 0.786 as the last retracement level before a rally is handed back almost entirely. For LINK, a daily close below it would put the $7–$7.95 demand zone flagged in the previous update, and the June low beneath it, back into view.
The Ceiling Keeps Dropping
The levels above price have also moved against LINK. In the first half of November, the token tested the overlap of its 200-day simple moving average at $10.1 and the 0.618 retracement near $10.30, then lost both in the mid-November breakdown. That former floor now stands as the first resistance.
Higher up, the moving averages are sliding. The 50-day SMA, which stood at $12.09 on November 15, has fallen to $11.65 and now sits just under the 100-day SMA at $11.70 on the live candle, close to the 0.5 retracement around $11.34. A daily close at those readings would confirm that the shorter average has crossed beneath the longer one — a pattern known as a death cross that traders associate with medium-term weakness.
Momentum has not turned either. The 14-day RSI reads 34.61, slightly below its 35.12 signal line, after dipping toward oversold territory — conventionally defined as readings below 30 — in mid-November.
Three Closes to Watch
Each scenario depends on where the daily candles finish.
The base holds. Daily closes stay above $8.81 and the RSI turns back above its 35.12 signal line. That combination would point to selling pressure fading at deep support and would put the $10.1–$10.30 zone back within reach.
The trend is reclaimed. Daily closes back above $10.30 would undo the November breakdown and bring the $11.34–$11.70 cluster — formed by the 0.5 retracement and the 50- and 100-day SMAs — into play.
The floor gives way. A decisive daily close below $8.81 would remove the last nearby Fibonacci support and leave the June swing low at $6.92 as the next major reference on this chart.
A climb to $10.30, the best case above, would still win back only part of the November drop. LINK would remain below two of its three major moving averages, with the 0.5 retracement level and the 50- and 100-day SMAs packed within roughly 40 cents of one another just overhead.
Disclaimer: This article is for informational purposes only and does not constitute financial, investment or trading advice. The technical levels and scenarios described reflect chart readings at the time of writing and are not predictions of future price movements. Cryptocurrency markets are highly volatile, and readers should do their own research and consider consulting a licensed financial adviser before making any investment decisions.

