Chainlink stalls below $9.56 as ETF inflows bolster breakout prospects
Key Takeaways
- •Chainlink was trading around $9.42 on Tuesday after failing to clear resistance near $9.56 following a weekly gain of more than 14%.
- •LINK's long-to-short ratio fell to 0.90, and its funding rate turned negative, indicating growing caution in derivatives markets.
- •Spot Chainlink ETFs recorded $2.07 million in net inflows on Monday, the largest single-day inflow since July 22.
- •LINK remained above its 50-day and 100-day exponential moving averages but stayed below the 200-day EMA at $9.56, which limited the recovery.
- •A daily close above $9.56 could strengthen the bullish outlook, while a drop below $9.39 could lead to a move toward lower support levels.
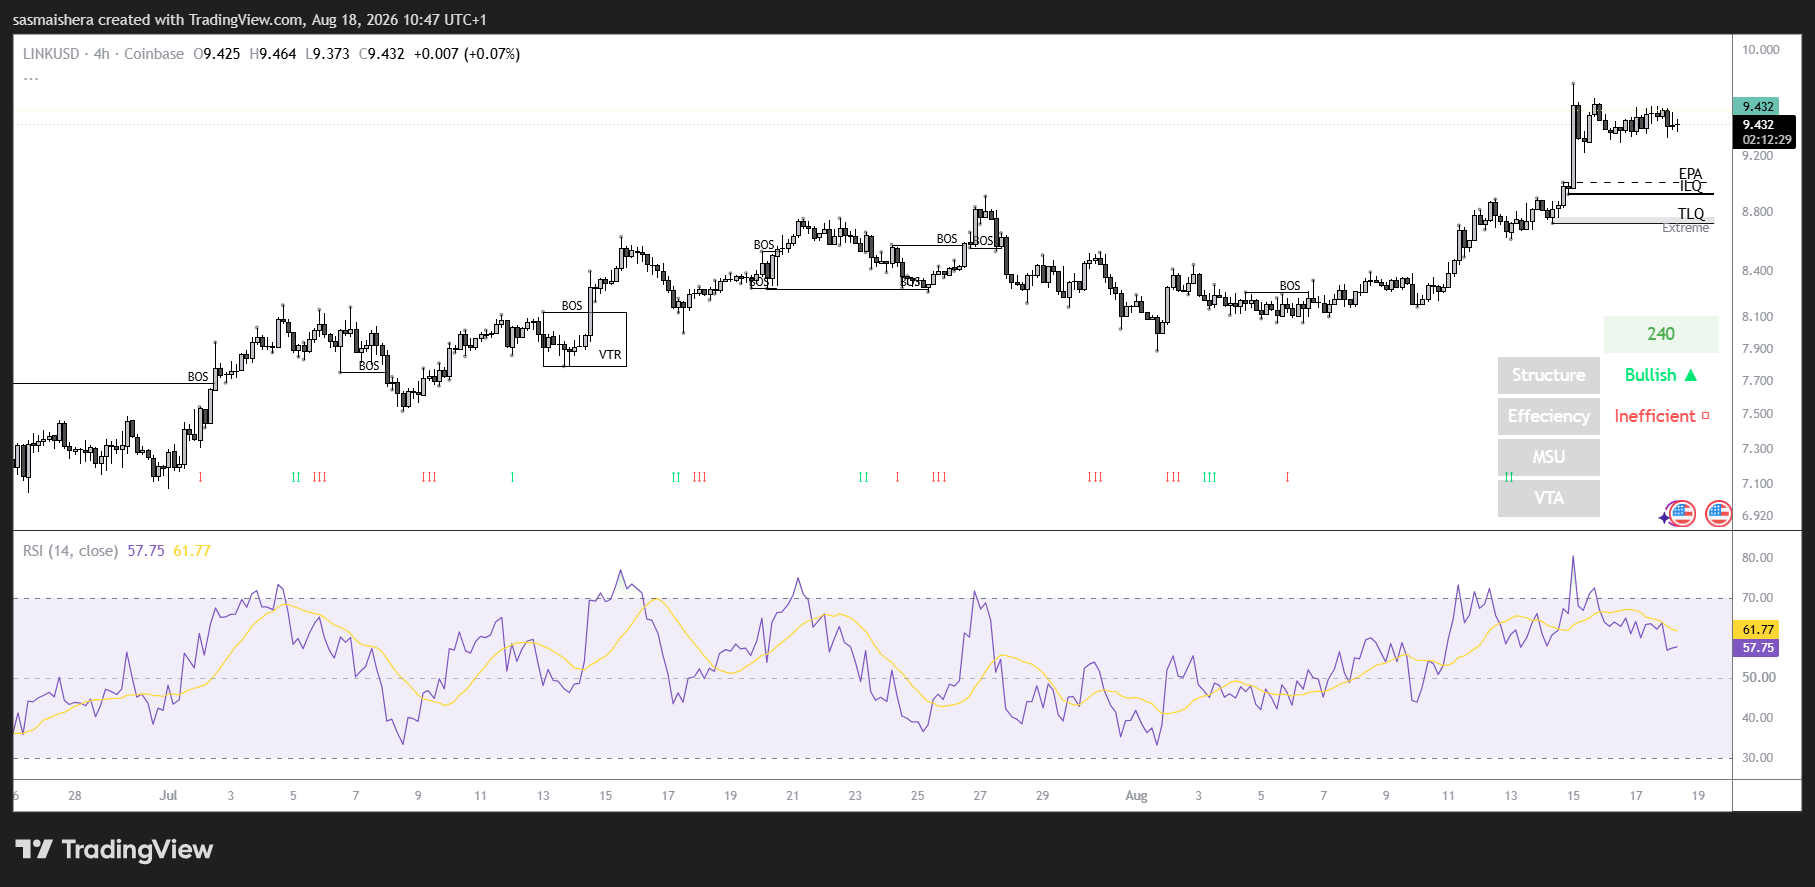
Chainlink (LINK) was trading around $9.42 on Tuesday as it struggled to clear resistance near $9.56, pausing after rallying more than 14% over the previous week. Chainlink's decentralized oracle network supplies real-world data such as asset prices to smart contracts and is widely used across decentralized finance, with the LINK token paying the node operators who secure that infrastructure. The stall comes as weakening derivatives indicators suggest bullish momentum may be losing strength, while renewed institutional demand through spot LINK exchange-traded funds could support another attempt to move higher.
Derivatives traders turn cautious
Data from CoinGlass shows early signs of softening sentiment in Chainlink's derivatives market. LINK's long-to-short ratio stood at 0.90 on Tuesday, close to its lowest level in a month. A reading below one indicates that short positions outnumber long positions, suggesting more traders expect the price to decline.
Chainlink's funding rate has also turned negative, falling to minus 0.0050%. Negative funding means short-position holders are paying traders with long exposure, reflecting a bearish imbalance in the perpetual futures market.
Taken together, the indicators point to growing caution among derivatives traders following LINK's double-digit weekly rally. However, heavily bearish positioning could also increase the possibility of a short squeeze if Chainlink breaks through its nearby resistance levels.
ETF inflows signal returning institutional interest
Institutional demand improved at the beginning of the week. Data from SoSoValue shows that spot Chainlink ETFs recorded $2.07 million in net inflows on Monday, the products' largest single-day inflow since July 22. Spot LINK ETFs began trading in the United States in late July 2025 following regulatory approval, and flows into such products have become a closely watched gauge of institutional crypto demand since US spot Bitcoin ETFs launched in January 2024. The increase suggests that institutional investors are rebuilding exposure to LINK following its recent recovery.
Continued ETF inflows could help absorb profit-taking and provide the demand needed for Chainlink to overcome the 200-day Exponential Moving Average. That said, a single day of positive flows is insufficient to establish a lasting trend. A sustained series of inflows throughout the week would provide stronger confirmation of renewed institutional interest.
Chainlink price outlook: LINK tests the 200-day EMA
Chainlink trades around $9.42 on Tuesday and remains above its 50-day and 100-day EMAs, positioned at $8.50 and $8.60, respectively. Holding above these moving averages supports a mildly bullish medium-term outlook. However, LINK remains below the 200-day EMA at $9.56, which is limiting the current recovery. The token has reclaimed the 61.8% Fibonacci retracement at $9.39, establishing this level as immediate support.
Momentum indicators remain constructive but show that LINK may be approaching stretched conditions. The Relative Strength Index is near 67, just below the overbought threshold of 70, while the Moving Average Convergence Divergence indicator remains positive. These readings suggest that buyers retain control but may encounter increasing resistance following last week's sharp rally.
A decisive daily close above the 200-day EMA at $9.56 would strengthen Chainlink's bullish outlook and bring the horizontal resistance at $9.92 into focus. Clearing both barriers could allow LINK to test the 78.6% Fibonacci retracement at $10.04. Beyond that, the cycle-high region around $10.87 represents the next major bullish objective.
On the downside, the 61.8% Fibonacci level at $9.39 provides the first line of support. A break below this area could trigger a pullback toward the 50% retracement at $8.94. Stronger support is concentrated between the 100-day EMA at $8.60 and the 50-day EMA at $8.50. Holding this zone would preserve the medium-term recovery structure, while a decisive breakdown could return control to sellers.
Source: CoinJournal

