Chainlink Price Forecast: LINK Projections for 2026-2032
Key Takeaways
- •LINK was trading around $8.77 on July 26 and remained above key support levels on the daily and 4-hour charts.
- •The source said a move above $8.97 could extend gains toward $9.20, while a break below $8.50 could risk a pullback toward $8.30.
- •Chainlink cited 14 new integrations of five services across 10 blockchain platforms, including Arbitrum, Avalanche, and Ethereum.
- •Robinhood Crypto adopted Chainlink as its official data and cross-chain oracle for Robinhood Stock Tokens, according to the announcement cited in the article.
- •The article’s long-term forecast places LINK at a maximum of $17 in 2026 and in a projected 2032 range of $21.78 to $52.95.
Chainlink could reach a maximum price of $17 in 2026, according to the forecast cited in the source material. By 2029, LINK could rise to a projected maximum of $28.53, while the 2032 outlook places Chainlink in a range between $21.78 and $52.95.
Chainlink has become a prominent platform in the cryptocurrency market by providing a secure, decentralized oracle network that connects smart contracts with real-world data. The project’s oracle infrastructure is designed to support blockchain applications that require external information, such as market prices, asset data, and other offchain inputs, a function that remains central to its role in decentralized finance (DeFi) and broader blockchain adoption.
As DeFi and blockchain technology continue to develop, Chainlink’s services have drawn attention from investors and traditional financial institutions. The network has also continued to expand its reach across the blockchain ecosystem through integrations and its cross-chain interoperability protocol, which is designed to help applications communicate and transfer data across different blockchain networks.
Recent updates cited in the source point to 14 new integrations of five Chainlink services across 10 blockchain platforms. Those integrations demonstrate Chainlink’s use across multiple networks, including Arbitrum, Avalanche, and Ethereum, and are intended to strengthen its position in the interoperability and decentralized application infrastructure market.
Assessing possible Chainlink price movements involves reviewing market trends, technology developments, partnerships, and broader market conditions. The following Chainlink price outlook is based on the source’s technical and fundamental observations, and the long-range figures should be read as forecasts rather than guaranteed outcomes.
Chainlink price analysis
LINK remains in a confirmed uptrend and is trading above key support levels on both the daily and 4-hour charts. Momentum remains bullish, although the relative strength index, or RSI, near 70 indicates the rally could pause before another upward move.
The source states that holding above $8.50 would keep the bullish outlook intact, while a breakout above $8.97 could extend gains toward $9.20.
Chainlink daily price chart
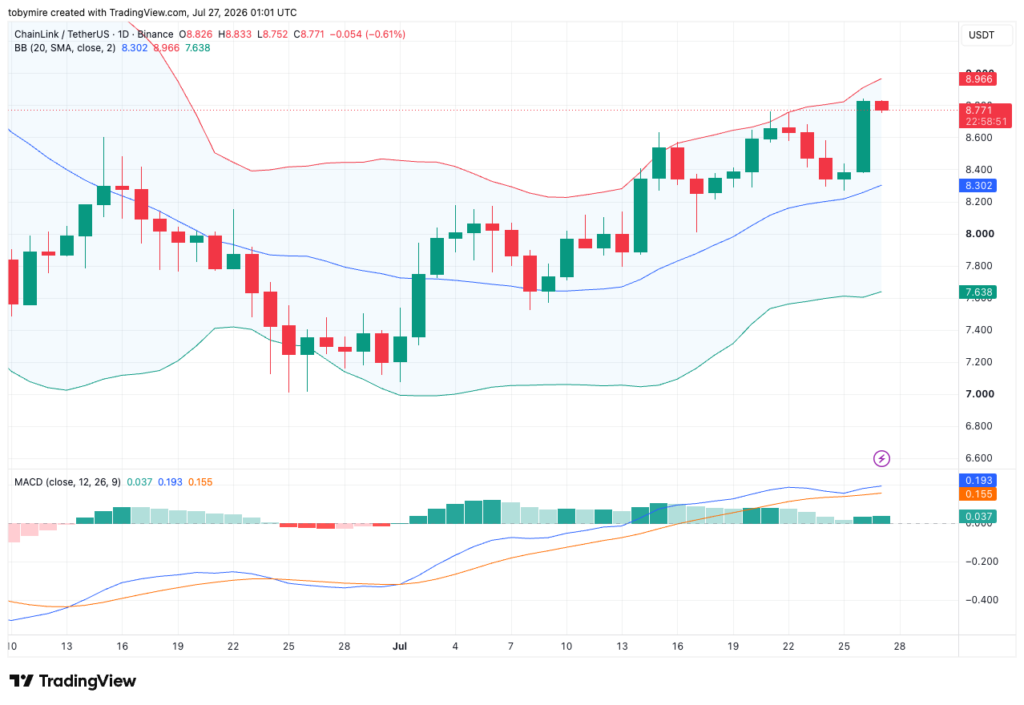
On the daily chart for July 26, LINK was trading around $8.77 and remained above the Bollinger Band midline at $8.30. The source said this showed that buyers were still in control. The price was testing the upper Bollinger Band near $8.97, where selling pressure had begun to appear after the recent rally.
The MACD remained bullish, with the MACD line above the signal line and both lines above zero. However, the histogram continued to shrink, suggesting that upside momentum was starting to cool. A daily close above $8.97 could open the path toward $9.20, while $8.30 was described as the key support level for maintaining the bullish structure.
Chainlink 4-hour price chart
The 4-hour chart also continued to favor buyers. LINK was trading above all three Alligator moving averages at $8.50 to $8.57, indicating a healthy short-term uptrend.
The RSI had climbed to 67, approaching overbought territory. The source said this showed strong buying momentum while also raising the possibility of short-term consolidation. As long as the price holds above $8.55 to $8.60, buyers remain in control. A move above $8.83 would strengthen the breakout, while a drop below $8.50 could trigger a pullback toward $8.30.
Chainlink technical indicators: levels and action
Daily simple moving average (SMA)
Daily exponential moving average (EMA)
What to expect from Chainlink
LINK remains one of the stronger-looking charts in the source’s technical review, with both timeframes supporting further upside. Some short-term consolidation remains possible after the recent rally, but the broader bias stays bullish as long as the $8.50 to $8.30 support area holds.
Chainlink’s investment profile
Chainlink remains an important participant in the blockchain ecosystem, supported by demand for decentralized oracle services and strategic partnerships that contribute to long-term adoption.
The source notes that moderate selling pressure remains, while Chainlink’s continued utility and real-world applications suggest potential for steady growth over time. Market participants are advised in the source to monitor key support and resistance levels to make informed decisions and manage risk effectively.
Could Chainlink reach $50?
Based on the long-term forecasts cited from industry experts, Chainlink (LINK) is projected to approach $50 by 2032.
Chainlink’s long-term outlook
Chainlink shows signs of stabilization and potential recovery, according to the source, indicating that the token may have a bullish case and a promising long-term future within the blockchain industry.
Recent Chainlink news
Chainlink is now powering Robinhood Stock Tokens and providing access to the onchain economy for millions of users, according to the announcement cited in the source. The announcement is notable because tokenized stock products require reliable external market data and cross-chain infrastructure to operate in blockchain environments.
LIVE: @RobinhoodCrypto adopts Chainlink as its official data and cross-chain oracle. Chainlink is now powering Robinhood Stock Tokens and unlocking access to the onchain economy for millions of users. Live on day 1. pic.twitter.com/z7IOCrLtOU — Chainlink (@chainlink) July 1, 2026
LIVE: @RobinhoodCrypto adopts Chainlink as its official data and cross-chain oracle. Chainlink is now powering Robinhood Stock Tokens and unlocking access to the onchain economy for millions of users. Live on day 1. pic.twitter.com/z7IOCrLtOU
Chainlink price prediction for July 2026
For July 2026, the projected minimum trading price is $7.19, with an average price of about $8.16. LINK is expected to reach a peak price of $11.51.
Chainlink (LINK) price prediction for 2026
The source projects that LINK could reach a maximum market price of $17.00 in 2026. The minimum expected trading price is $7.00, influenced by the overall market capitalization and external data sources. The average Chainlink price for 2026 is forecast at $11.38.
Chainlink price prediction for 2027-2032
In 2027, Chainlink is forecast to reach a maximum value of $19.46, a minimum price of $8.01, and an average value of $13.02.
For 2028, LINK’s average price is expected to be $13.66. Its minimum and maximum trading prices, based on historical performance cited in the source, are projected at $8.40 and $20.41, respectively.
The Chainlink price forecast for 2029 places the high at $28.53. LINK is expected to reach a minimum price of $11.74 and an average price of $19.11.
According to the 2030 Chainlink price prediction, LINK is forecast to trade between $15.10 and $36.68, with an average price of $24.57.
In 2031, the Chainlink prediction expects LINK to reach a maximum value of $44.80, a minimum price of $18.44, and an average value of $30.01.
The projection rises further in 2032. According to the forecast, LINK’s price will range between $21.78 and $52.95, with an average price of $35.45.
Chainlink market price prediction: Analysts’ LINK forecast
Cryptopolitan’s Chainlink price prediction
According to Cryptopolitan’s Chainlink price forecast, the coin’s market price could reach a maximum value of $13 by the end of 2026. In 2028, LINK could rise to a maximum price of $34.09.
Chainlink’s historical price performance
Chainlink launched at around $0.20 and stayed below $1 through 2018. It then moved above $3 by the end of 2019 as adoption of its oracle network expanded.
LINK recorded a major breakout in 2020, rising from roughly $2 to $20 during the DeFi boom. It later reached an all-time high near $52 in May 2021 before falling sharply alongside the broader cryptocurrency market.
In 2022 and 2023, LINK mostly traded between $6 and $25 as bearish sentiment dominated crypto markets. A recovery followed in 2024, when the coin climbed as high as $30.94 in December after spending much of the year fluctuating between $10 and $18.
In 2025, LINK peaked at $22.90 in January, traded between $13 and $16 for much of the year, briefly rallied above $23 in September, and ended the year near $14.67.
In 2026, Chainlink remained under pressure. It traded between $13.6 and $14.2 in January, fell as low as $7.40 in February, and ranged between $8.29 and $10.05 in March. LINK averaged around $9 in April and traded near $9.55 in May.
In June, LINK weakened further, trading between roughly $7.07 and $8.30. In July, LINK was trading around $8.3, showing a modest rebound while still remaining below the $9 level.

